
Figures & data
Figure 1. The conservation estate and industry lands across the central and northern Burrup, within the National Heritage Listed Place, showing the two Nganjarli survey locations.
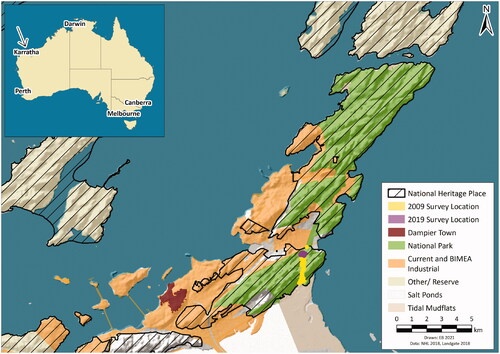
Figure 2. Deep Gorge systematic survey showing location of the recorded sites (after McDonald CHM Citation2009: Figure 12).
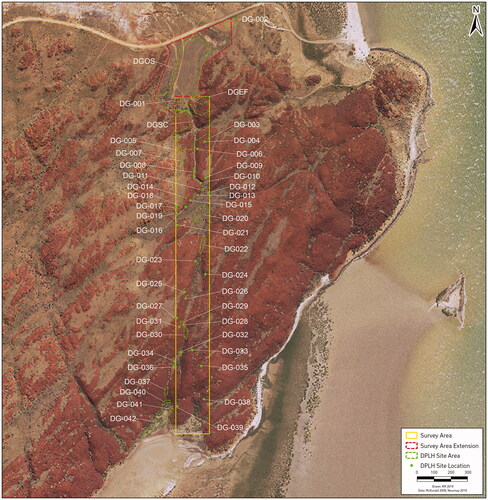
Figure 3. Nganjarli 2019 survey area in relation to Hearson Gorge and other sites registered with the Department of Planning Lands and Heritage (DPLH).
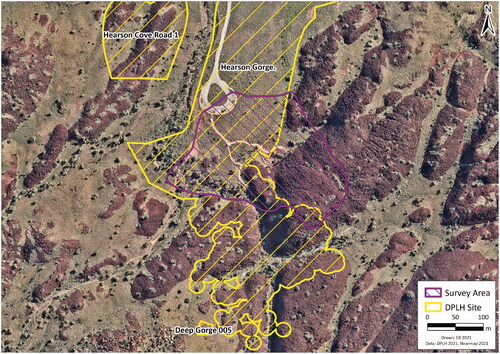
Figure 4. Two panel examples DG-2019-E191 (a) DG-2019-E154 (b) showing numbering of identified motifs with the ©ProCreate program using iPad.
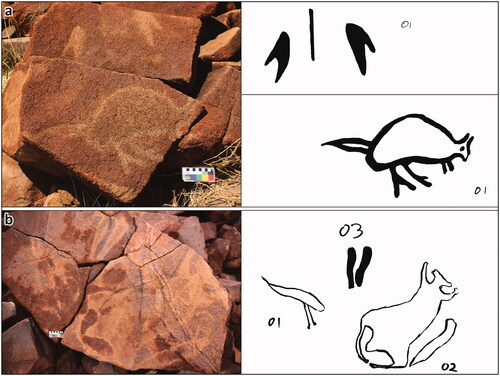
Figure 5. Nganjarli panels, stone features and the artefact sample squares. New boardwalk adjacent to 2019 panels is visible in aerial imagery as well the car park and footpaths.
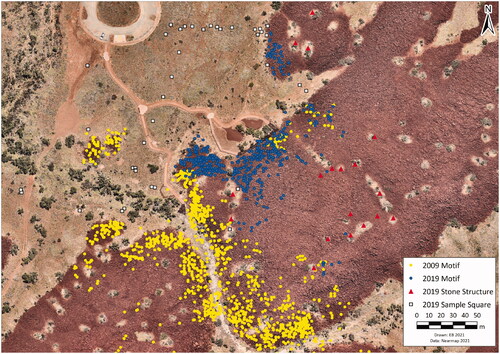
Table 1. Nganjarli Subject Proportions, Identifiable motifs grouped by class.
Figure 6. Thylacine (Tasmanian tiger) depictions, all with the elongated body, proportionally large head, limbs of comparable length, straight extended tail and in four cases with the vertical-aligned strips within the body typical of this species (scale bar = 10 cm).
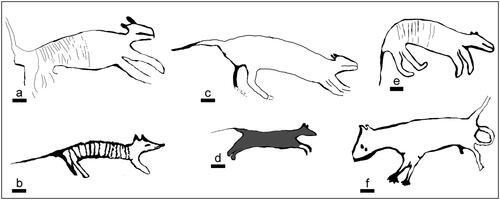
Figure 7. Quadruped depictions, some representing Tasmanian devil (a–f) and others less diagnostic (j–n), possibly Northern quoll (j,k).
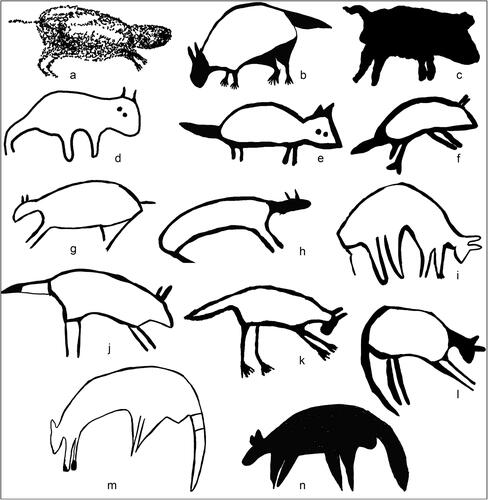
Figure 8. Macropod depictions including a possible extinct fat tailed species with a distinctive bulge-tail (a–f), others with more standard tail shape and thickness; note the greyed motifs occur on the same panels as the motifs shown.
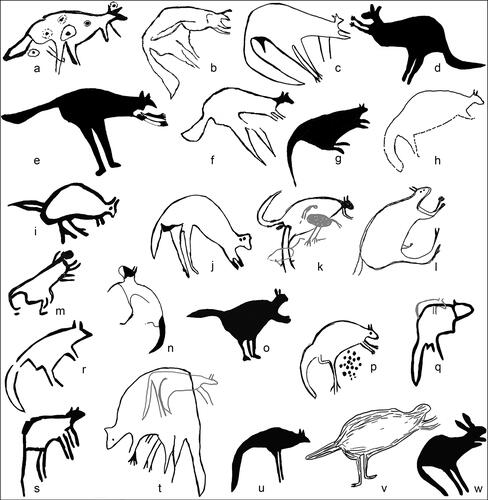
Figure 9. Reptile (a–i), snake pair (j) and echidna depictions (k–s), the latter in profile and flattened, splayed view perspective; including one petroglyph that may represent Zaglossus hacketti (s).
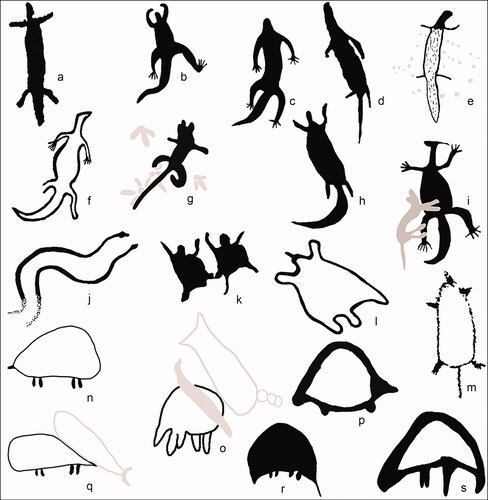
Figure 10. Bird depictions showing the variation in form and graphic attributes; bustard (j) and emus (l–p) are the more diagnostic species.
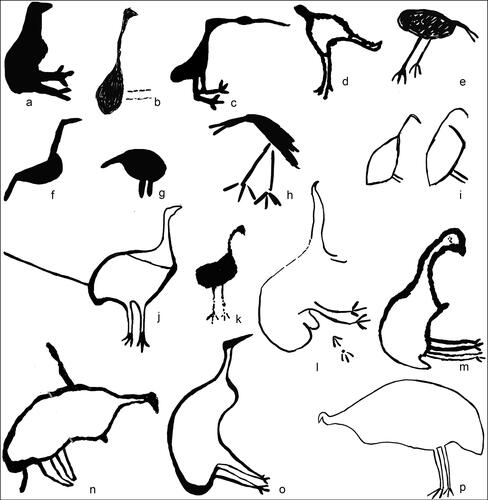
Figure 11. Marine faunal depictions including turtle (marine and freshwater; a–i), sawfish (j) and stingray (k), and less-diagnostic marine mammals and fish (l–r); note the greyed motifs occur on the same panels as the motifs shown.
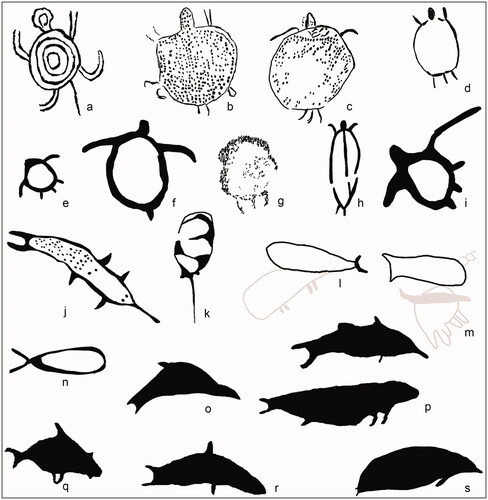
Table 2. Nganjarli Contrast State, as a measure of weathering exposure as a proxy for relative chronology, in relation to motif class.
Figure 12. Macropod (a–n) and bird (o–z) track motifs showing range in style and arrangement of track: single, paired and multiple configurations including macropods with tail imprint motif (b and d); note the greyed motifs occur on the same panels as the motifs shown.
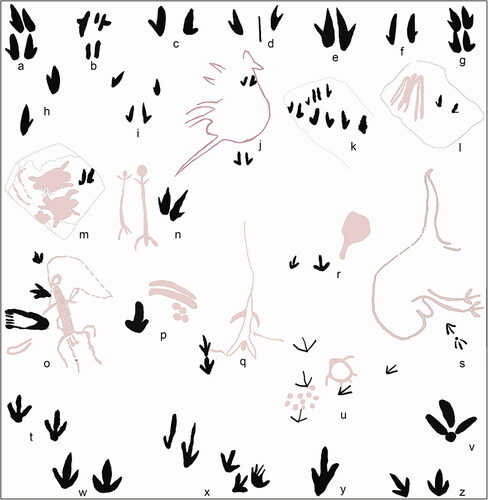
Figure 13. Subject counts and proportions of Contrast State, comparing animal-like and track-like petroglyphs.
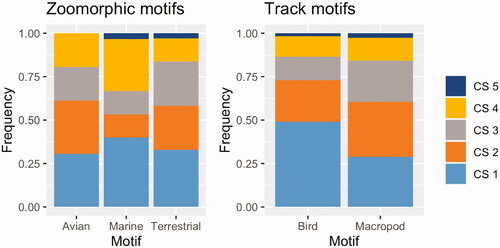
Figure 14. Chi-Square analysis of the proportion of contrast states in marine versus terrestrial species in this assemblage.
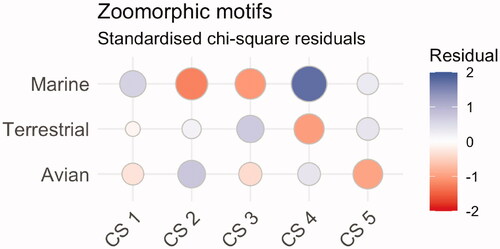
Figure 15. Nganjarli stone structures identified in 2019. Aerial imagery ©Nearmap 2021. Digital Elevation Model ©ESRI 2021. Inset shows location of section on 3D Model created from terrestrial imagery: the stacked stones are prominent in the location of the arrow.
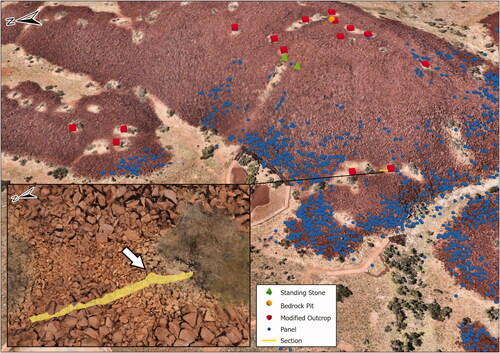
Figure 16. (a) Standing Stone DG-2019-EF004; (b) Level area at DG-2019-EF014 showing calcrete in situ and dispersed with lithics and shellfish.
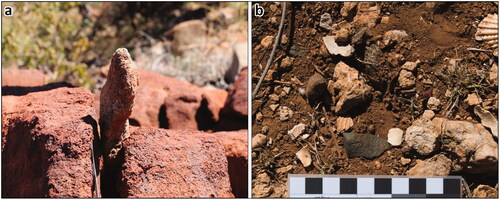
Figure 17. Recorded sample squares and the density of artefacts in each square; the old and new car park, walkways and platforms evident in the base image.
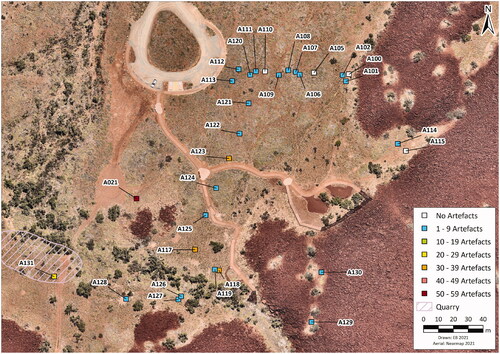
Figure 18. Nganjarli lithic assemblage characteristics of the 256 artefacts sampled.
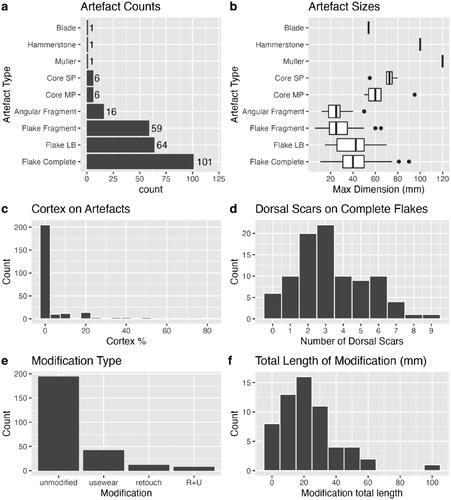
Figure 19. Nganjarli lithic artefact materials by grain quality and colour; excluding two quartz pieces and one multiplatform chert core.
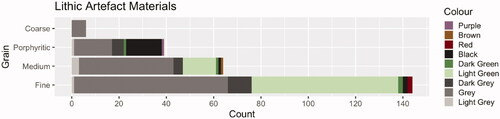
Figure 20. pXRF scatter plots for the Nganjarli artefacts and bedrock samples; the rock type fields derive from more detailed analytical processes (Fairweather Citation2019).
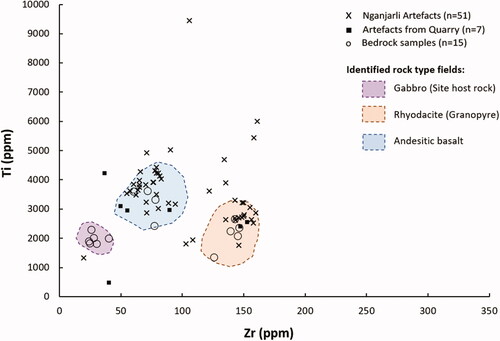
Figure 21. Geological base map of Nganjarli surrounds (from Donaldson Citation2011). Three artefact source types occur within 300m (gabbro, rhyodacite and andesitic basalt), with two sediment-dominated lithologies.
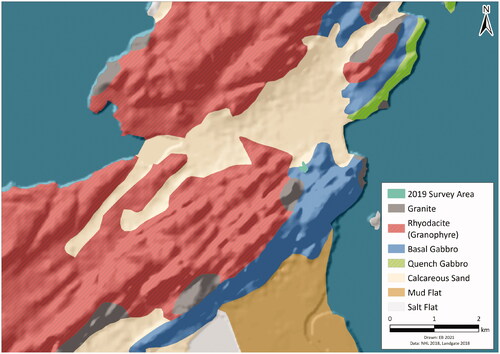
Figure 22. Nganjarli Tegillarca cf. zanzibarensis MNI showing mean length of the two sample squares.
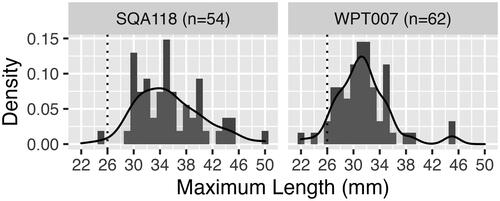
Table 3. Tegillarca cf. zanzibarensis valve sizes.
Figure 23. The official opening of Nganjarli Boardwalk with the W.A. State Minister for Environment, Hon Stephen Dawson MLC (a); and Murujuga Ranger Sarah Hicks leading an interpretive tour at Nganjarli (b) (photos permission of MAC).
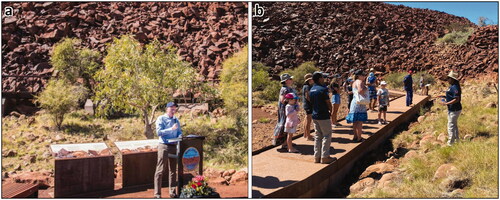
Figure 24. Two of the interpretive signs that focus on animals and local art traits, installed as part of the new Nganjarli tourist development.
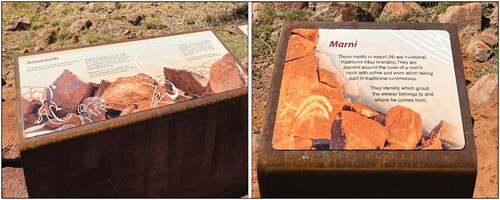
Figure 25. The Nganjarli site showing the location of the selected petroglyphs suitable for public education and awareness in the vicinity of the proposed walkway.
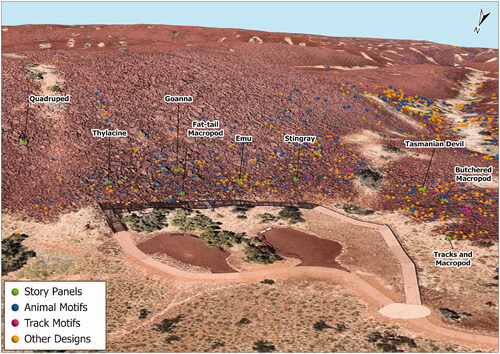
Table 4. Nganjarli National Heritage values and NHL criteria.