Figures & data
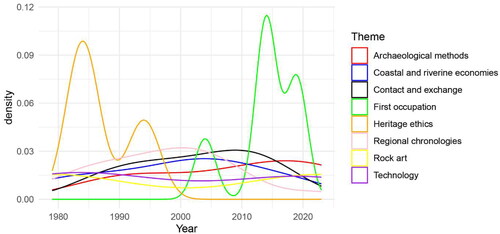
Figure 1. Density plot showing the change over time in research theme of the 50 most cited papers in Australian Archaeology from 1974 to 2023, calculated as the top-5 most cited articles in each 5-year period 1974–2024. Data from scopus (2000–2023) and Australian Archaeology journal table of contents (1974–1999).