Figures & data
Figure 1. Location of Club Parramatta, 2 Macquarie Street, Parramatta (the site) (Source: NSW Foundation Spatial Data Framework).
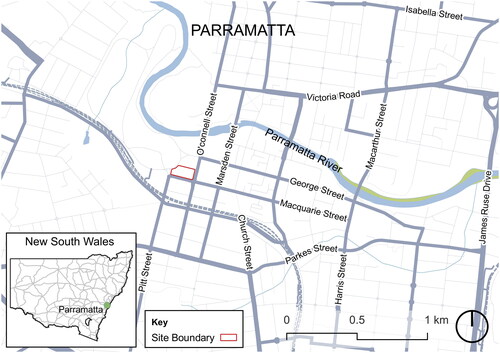
Figure 2. Plan of the Club Parramatta site showing the allotments, huts and distribution of archaeological evidence related to the hut phase.
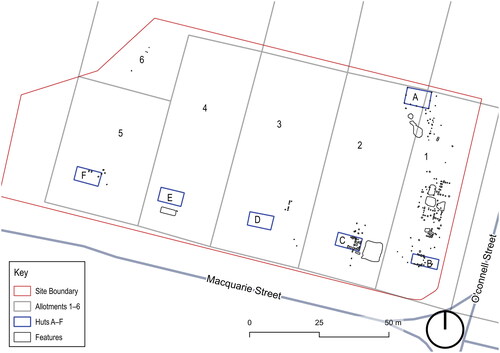
Figure 3. Resumed domain area with interpreted allotments to be resumed. The 1804 Plan of Parramatta has been overlayed (Source: The National Archives UK, Citation1804, Map CO.700.22), with the allotments likely to be included in the resumption highlighted in orange and numbered to allow correlation with .
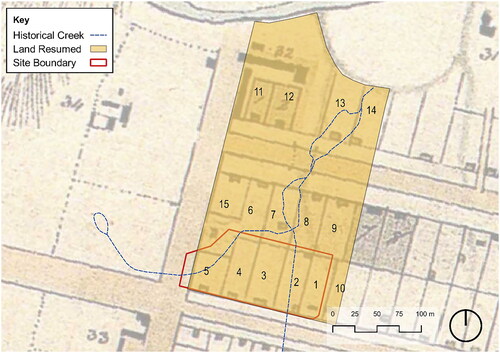
Table 1. Summary of known lives of occupants of land resumed from the government domain in 1818.
Table 2. Summary of the archaeological evidence from huts at the site (Source: GML Heritage Citation2023).
Figure 4. Plan of Huts B and C and associated features, showing artefact densities and key conjoins between features. Artefacts are counted by minimum number of individuals (MNI), with brick pieces excluded from artefact counts in post-holes.
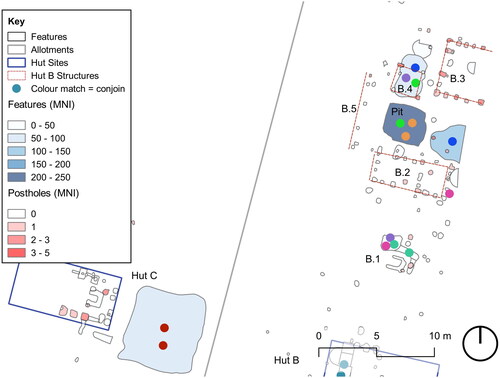
Figure 5. Select artefact types from around Allotment 1 and 2 structures. Each coloured point represents one artefact by MNI, which are centred around the feature with which they were associated.
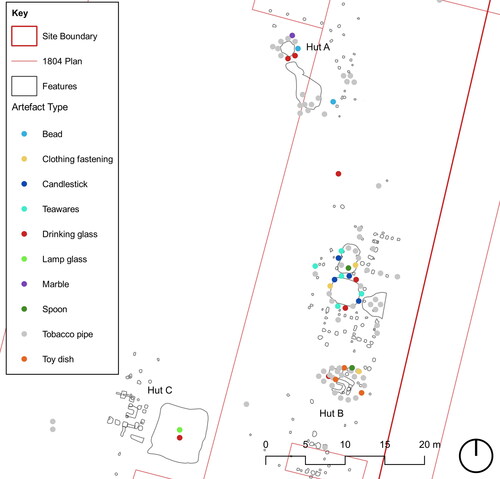
Figure 6. Functional analysis of artefacts from major features near Hut A (round rubbish pit), Hut B (rectangular pit, adjacent rubbish spreads and linear features of B.1) and C (pond), showing artefact functions as a percentage of the total artefacts by MNI in each area and an average across the site, excluding artefacts of unidentifiable function.
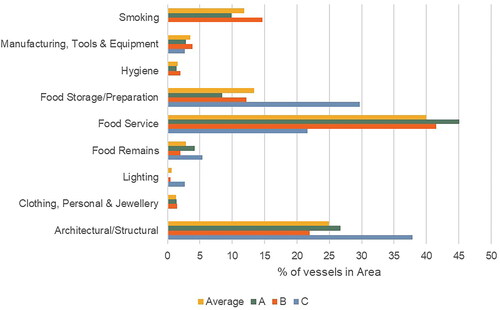
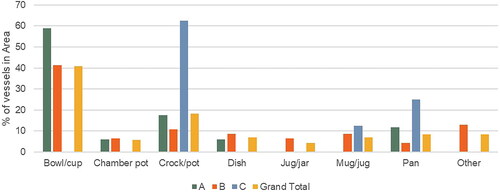
Figure 7. Comparison of locally made vessel forms from major features around Huts A (round rubbish pit), B (storage pit, adjacent rubbish spreads and linear features of B.1) and C (pond), showing artefact forms as a percentage of the total artefacts in each area and the total of all three together. Analysis excludes artefacts of unidentifiable forms and merges some form categories for simplicity.