
Figures & data
Figure 1. Basic components of RL: environment, state, action, agent, and reward.
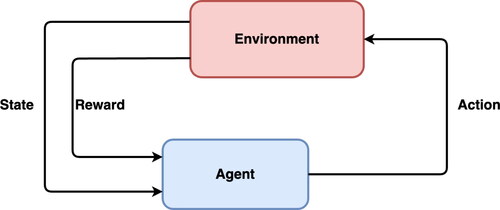
Table 1. Key notations for the Q-Learning algorithm.
Figure 2. Visualization of the Q-Table.
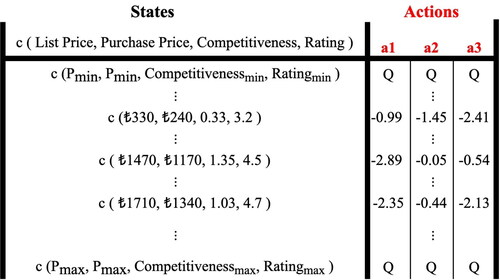
Table 2. Feature categories and the number of features in each category.
Figure 3. Total room based demand of the all hotels by year & month.
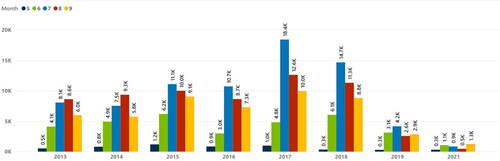
Figure 4. Reward rate distribution.
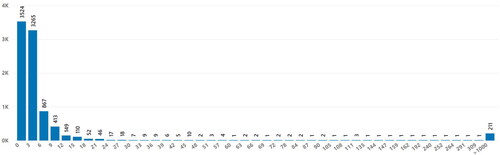
Figure 5. Profit rate distribution.
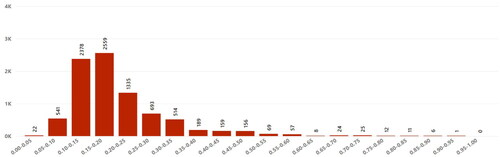
Table 3. Hyperparameter space for the proposed pricing model and their candidate values.
Figure 6. Offline evaluation for proposed reward function with different state space size.
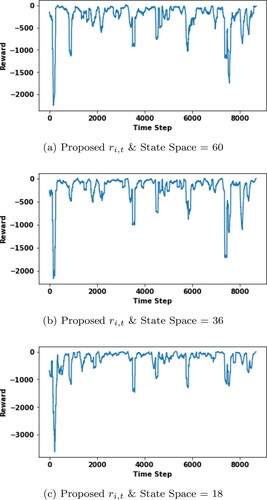
Figure 7. (a, c, e) Offline evaluation for reward function with different state space size. (b, d, f) Offline evaluation for reward function
with different state space size.
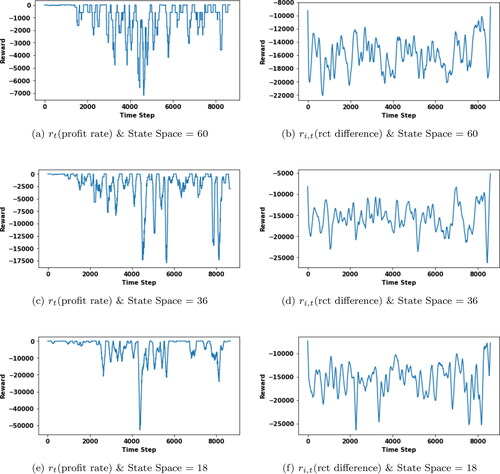
Table 4. MAPE Results of test sets representing different time periods.
Table 5. Results comparison with the most dense region: ‘‘Side/antalya/Turkey’.