
Figures & data
Figure 1. Collaborative action research cycles stages and cycles based on Butler, Schnellert, and Cartier (Citation2013).
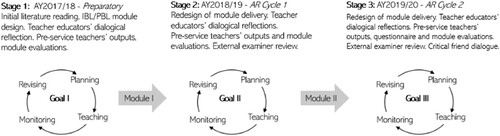
Figure 2. Timeline of the IBL approach (based on Pedaste et al. Citation2015).
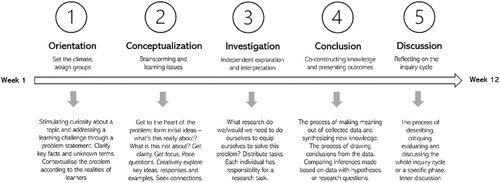
Table 1. Mapping the curriculum and assessment module learning outcomes and continuous assessment tasks.
Table 2. Pre-test and post-test comparison of means (n = 33).