
Figures & data
Fig. 1: Aerial view of Tel Lachish from the north, photographed on July 18, 1934 (Ussishkin Citation2004b: 24 .3); note the excavated area along the Outer Revetment Wall on the northern and western slopes of the mound
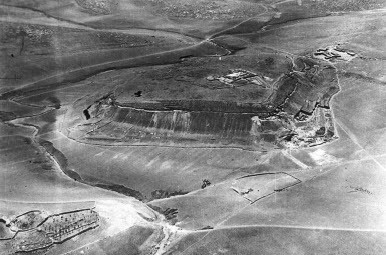
Fig. 2: The plan of Tel Lachish according to the TAU expedition (based on Ussishkin Citation2004b: 34, .9), showing the location of the mudbrick wall of the tower-buttress sampled for this study (LC08); 1) outer gate; 2) Level IV–III inner gate; 3) the Outer Revetment Wall marked all around the mound, excluding the gate area and a gap in the northeastern corner of the mound; 4) the main city wall; 5) the siege ramp
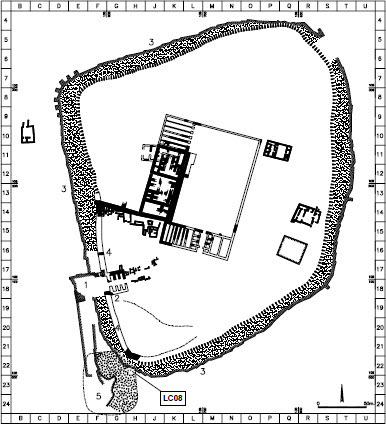
Fig. 3: The Assyrian siege ramp and Area R in 1983, view from the southwest (based on Ussishkin Citation2004a: 705, .10); the location of the Outer Revetment Wall is marked by a dashed white line
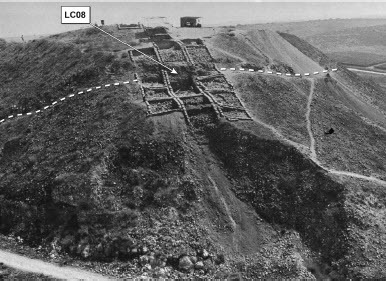
Fig. 4: The southwestern corner of Tel Lachish and the excavations at Area R of the TAU expedition (based on Ussishkin Citation2004a: 702, .6); the location of LC08 is marked; note the Outer Revetment Wall which abuts the tower-buttress on both sides
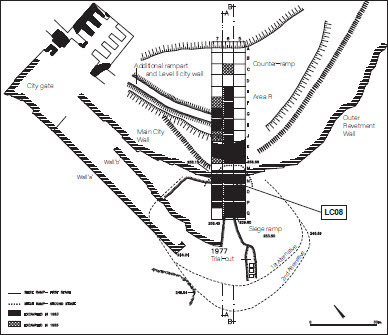
Fig. 5: A longitudinal section through the southwestern corner of the mound, extending along the northwestern sides of Squares A–Z/6 in Area R of the TAU expedition (based on Ussishkin Citation2004a: 703, .7); 1) the siege ramp with two alternative reconstructions; 2) the tower-buttress in the Outer Revetment Wall; 3) the siege ramp, second stage (covering the tower-buttress); 4) the Main City Wall; 5) the counter-ramp; 6) the additional rampart and the Level II city wall
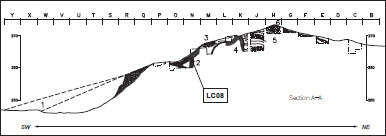
Fig. 6: Suggested reconstruction of Lachish Level III according to the TAU expedition (Ussishkin Citation2004c: 85, .1; drawing by Judith Dekel); note the Outer Revetment Wall encircling the mound at mid-slope
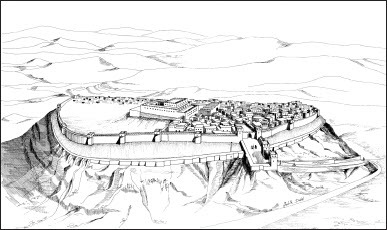
Fig. 7: The location of LC08 on the outer face of the tower-buttress; a) the tower-buttress exposed in 1985 (Ussishkin Citation2004a: 710, .14); note that one person is standing at the foot of the tower and another is sitting on the balcony on top of the tower; the estimated location of LC08 is marked; b) the location of LC08 during our archaeomagnetic sampling
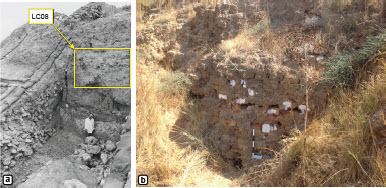
Fig. 8: The location of the different samples for palaeointensity and archaeomagnetic directions (LC08); Samples A–C are unoriented samples taken for palaeointensity only; all others were sampled as oriented samples and thus the flat surfaces and the use of plaster of Paris can be seen
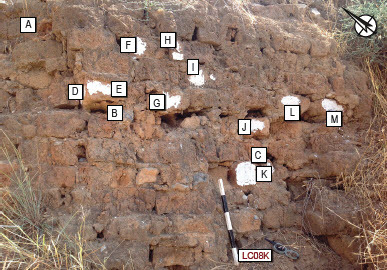
Fig. 9: Representative examples of sampling and sample preparation; a) Samples D, E and G; note that D and E were sampled from two sides of the same brick; b) Samples J and L; c) closeup of Sample I; d–f ) Sample K after it was initially cut in the lab for archaeomagnetic direction experiments (d–f at 1:4 scale)
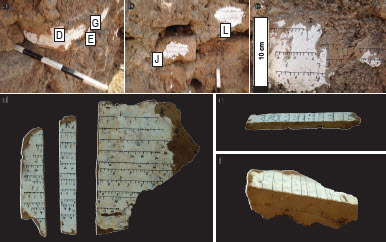
Fig. 10: Representative result from the Alternating Field (AF) demagnetisation experiment of one specimen displayed as a Zijderveld diagram (Zijderveld Citation1967); since the magnetic signal is a three-dimensional vector, it is displayed by two lines (red and blue), each representing the projection of the vector on a different plane; the original magnetisation is gradually erased by an increasingly strong magnetic field (4.0mT, 8.0mT, etc.); it displays a strong magnetic vector and straight lines converging to the origin indicating stable magnetisation
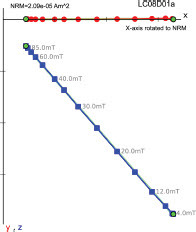
Fig. 11: Direction results; mean directions of the different samples of LC08 are plotted as coloured symbols on an equal area projection; their α95 confidence cones are plotted as coloured circles; the average direction and the α95 cone of the samples from the gate of Lachish Level III are plotted in black, representing the direction of the geomagnetic field in the Levant in 701 BCE, as published in Vaknin et al. Citation2022: 2
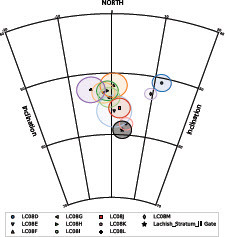
Table 1: Direction results
Fig. 12: Representative results of paleointensity experiments all carried out on a specific specimen: a) a representative Arai plot, where blue circles, red circles and triangles represent IZ steps, ZI steps and pTRM checks, respectively; the inset displays the Zijderveld (Citation1967) plot of all the demagnetisation steps; the nearly ideal behaviour is characterised by a straight Zijderveld plot converging to the origin (inset), a nearly linear Arai plot and pTRM checks (triangles) which overlap the infield data points (red circles); the Zijderveld plot (inset) represents the projection of the vector on two different planes; b) the magnetisation after the different steps of the paleointensity experiment; the Y-axis represents the magnetisation normalised to the initial magnetisation of the specimen; the X-axis represents the temperature steps; the blue graph represents the initial magnetisation recorded in the past; it starts at 1.0 by definition and decreases gradually; note that the magnetisation is nearly entirely erased only at 600 °C; the red graph represents the magnetisation recorded in the lab, starting at 0.0 by definition and rising with the rising temperature steps; c) a representative result of a cooling rate correction experiment
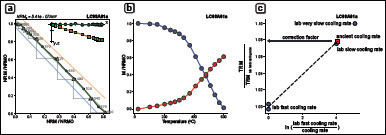
Fig. 13: Archaeomagnetic dating of LC08; a) the archaeomagnetic curve in the Levant based on all the data of LAC.v.1.0 and LAC.v.1.1 (see text for details); the blue line and light blue area represent the mean PI of LC08 and its standard deviation, accordingly; they are presented along all the prior age range of LC08 (1800–680 BCE); the intensity of the geomagnetic field at Lachish in 1980 CE (83 ZAm^2) is marked by a dashed green line; b) the result of the archaeomagnetic dating of LC08: the prior age range of LC08 which was used by the AH-RJMCMC algorithm (Livermore et al. Citation2018) is represented as a uniform probability density function (grey background); the posterior age probability distribution for LC08 is displayed in blue
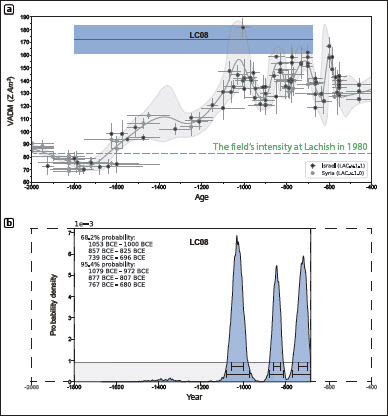
Table 2: Palaeointensity results
Fig. 14: Thermomagnetic curves; we measured the magnetic susceptibility in repeated heating cycles at progressively elevated peak temperatures in the range of 100–700 °C (each colour represents one cycle); the solid lines represent the heating process whereas the dashed lines represent the cooling process; the thermomagnetic curve of LC08D is nearly reversible (a), demonstrating little alteration, which is indicative of stability of the magnetic minerals up to 700 °C; the thermomagnetic curves of LC08J (b) and LC08L (c) are nearly reversible up to 600 °C, but significant alteration was observed after heating these specimens to 700 °C (red dashed lines); only in the case of LC08D was a small drop in the susceptibility observed at ca. 350 °C; the main drop in the susceptibility in all three specimens occurred between ca. 580 °C to 620 °C, probably indicating the presence of magnetite
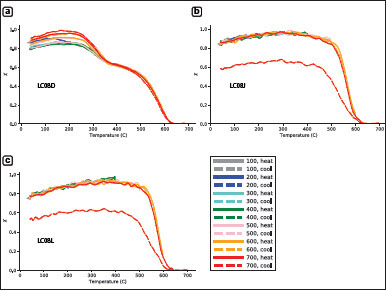
Fig. 15: Two examples of the use of fire in warfare depicted in Assyrian reliefs; a) part of the Lachish relief from Sennacherib’s palace at Nineveh (Ussishkin Citation1982: Fig. 78; drawing by Judith Dekel); note the torches thrown from above and the Assyrian soldier pouring water in front of the siege engine; b) a relief from Ashurbanipal’s palace at Nineveh depicting the Assyrian conquest of an Egyptian city; an Assyrian soldier setting the city gate on fire is marked (photo: Osama Shukir Muhammed Amin FRCP [Glasg], CC BY-SA 4.0, via Wikimedia Commons)
![Fig. 15: Two examples of the use of fire in warfare depicted in Assyrian reliefs; a) part of the Lachish relief from Sennacherib’s palace at Nineveh (Ussishkin Citation1982: Fig. 78; drawing by Judith Dekel); note the torches thrown from above and the Assyrian soldier pouring water in front of the siege engine; b) a relief from Ashurbanipal’s palace at Nineveh depicting the Assyrian conquest of an Egyptian city; an Assyrian soldier setting the city gate on fire is marked (photo: Osama Shukir Muhammed Amin FRCP [Glasg], CC BY-SA 4.0, via Wikimedia Commons)](/cms/asset/476b6b4e-3c09-4bc3-9d46-183e3be1fa3d/ytav_a_2327801_f0015_c.jpg)