
Figures & data
FIGURE 1 Average yearly number of job seekers in employment offices in Finland, 1973–1999.Footnote82
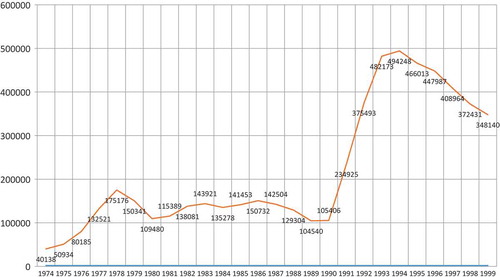
FIGURE 2 Yearly change of gross national product in Finland, 1975–1999 (%).Footnote83
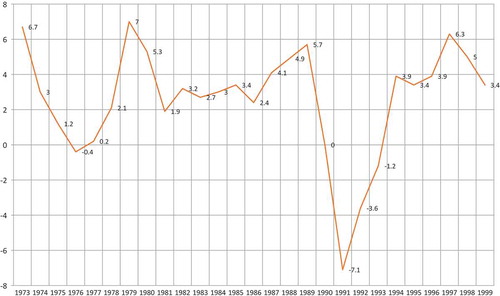
FIGURE 1 Average yearly number of job seekers in employment offices in Finland, 1973–1999.Footnote82
FIGURE 2 Yearly change of gross national product in Finland, 1975–1999 (%).Footnote83