Figures & data
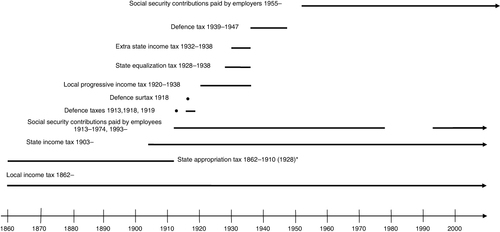
*The state appropriation tax was transformed to a local tax in the 1911 tax reform, and the appropriation system worked as a parallel local tax system between 1911 and 1928.
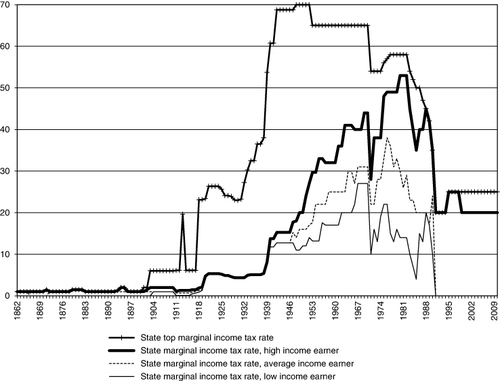
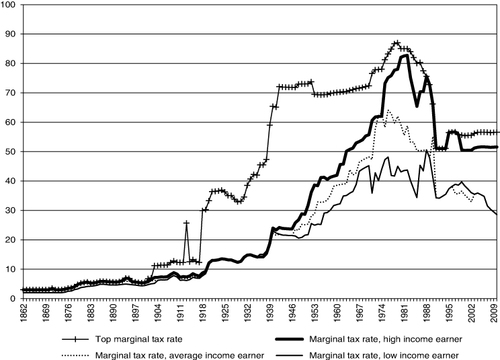
Note: High-, average- and low-income earner refers to 167, 100 and 67% of the wage of an average-income earner, respectively. The spike in the state top marginal income tax rate in 1913 refers to a temporary defence tax that was decided in 1914 but based on the income in 1913 (hence it was a retroactive tax). It was considered so heavy that payment was split over three years 1915, 1916 and 1917. The dip in 1971 is explained by adjustment of the state tax due to the abolishment of the deduction for local taxes.
Source: Own calculations based on sources in Appendix.
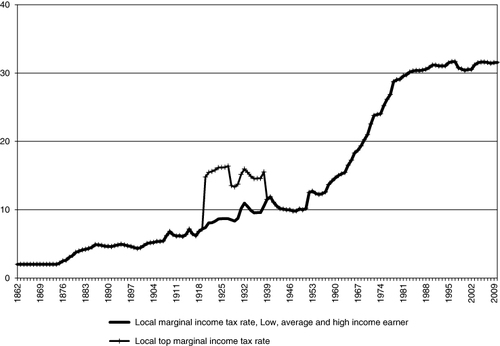
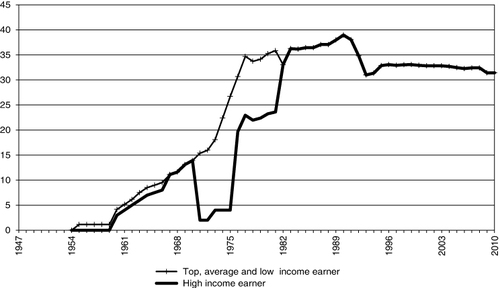
Note: See .
Source: Own calculations based on sources in Appendix.
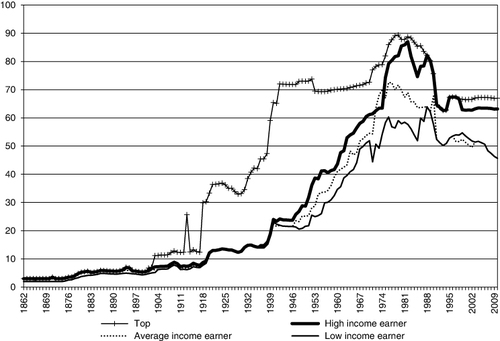
Note: See . The marginal tax rate is the sum of the state and local marginal income tax rates as well as SSCs paid by employees, considering that local income taxes were deductible from the state income tax base between 1920 and 1970.
Source: Own calculations based on sources in Appendix.
Note: See .
Source: Own calculations based on sources in Appendix.
Note: See . The tax wedge on the average-income earner is higher than that for the high-income earner at the beginning of the 1970s due to a much lower marginal SSCs paid by the high-income earner. The tax wedge on the low-income earner is higher than the average-income earner's wedge at the end of the 1990s due to a decreasing basic allowance, which affects the tax rate for the low-income earner.
Source: Own calculations based on sources in Appendix.
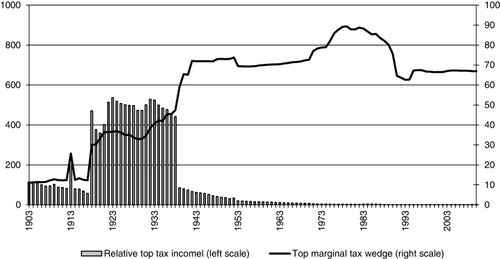
Note: Right scale refers to the marginal tax wedge (%) and left scale to the relative top tax income level expressed as the number of average-income earner wages at which the top marginal tax wedge starts to apply.
Source: Own calculations based on sources in Appendix.