Figures & data
Figure 1. The nominal Housing Price Index 1818–1875 according to the WRS and SPAR methods, 1818 = 100.
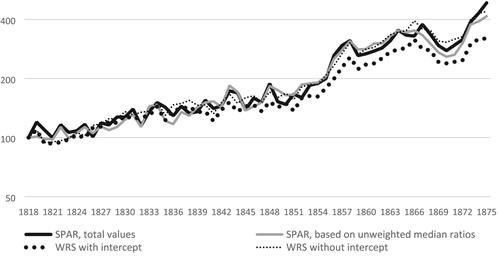
Figure 2. The nominal Housing Price Index 1818–1875 according to the SPAR method using two different taxation assessments, 1818 = 100.
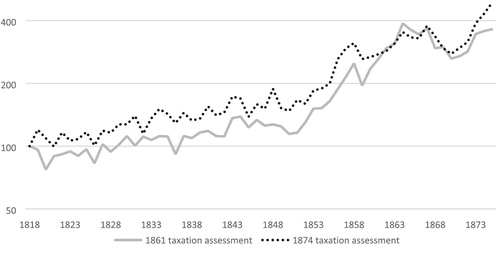
Figure 3. The estimated nominal Housing Price Index of Stockholm 1818–1875 (1818 = 100), geometric 3-year moving average, in different geographical areas in Stockholm, using SPAR and the taxation values of 1874.
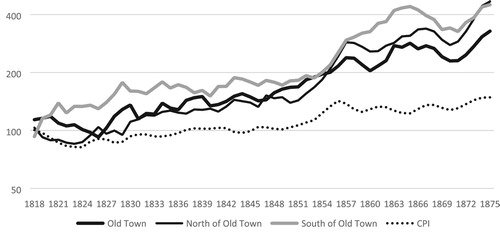
Figure 4. The nominal Housing Price Index 1818–2018, 1818 = 100.
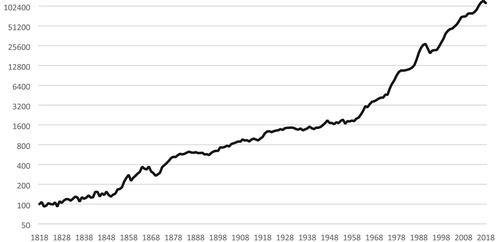
Figure 5. Stockholm Housing prices, deflated by the CPI and the GDP per capita, 1818–2018, 1818 = 100. Source: Our data and Söderberg et al. (Citation2014).
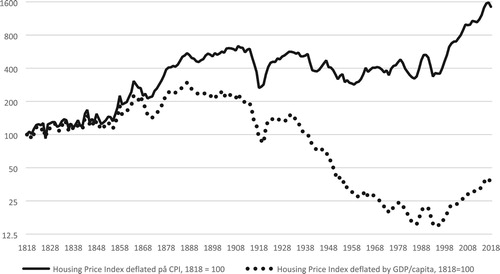
Figure 6. Population of Stockholm municipality and inner city 1800–2017. Source: Ström (Citation2005) and www.scb.se
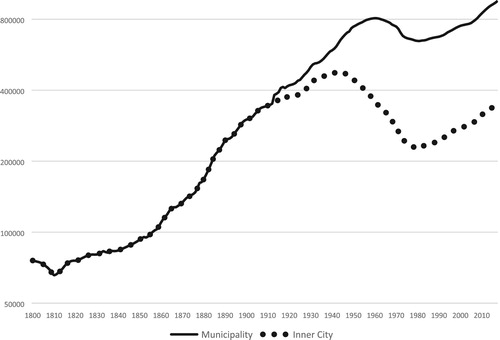
Figure 7. The ten sharpest falls in nominal housing prices in Stockholm 1818–2018 during a period of maximum 15 years that do not overlap.
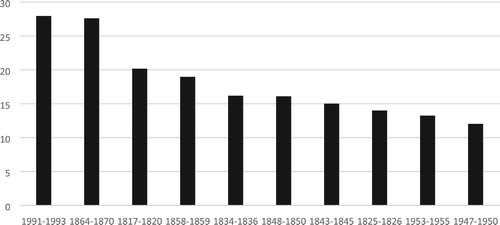
Figure 8. The ten sharpest falls in real housing prices in Stockholm 1818–2018 during a period of maximum 15 years that do not overlap.
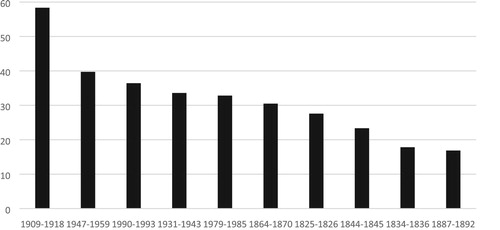
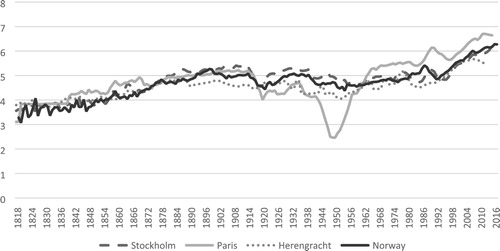
Figure 9. Real Housing prices 1818–2017; Stockholm, Norway, Paris, and Herengracht. Indices in natural logarithms.