
Figures & data
Figure 1. Real GDP per capita in 2011 USD, 2011 benchmark. Source Maddison Project Database, version 2018. Bolt, Jutta, Robert Inklaar, Herman de Jong and Jan Luiten van Zanden (2018), www.ggdc.net/maddison.
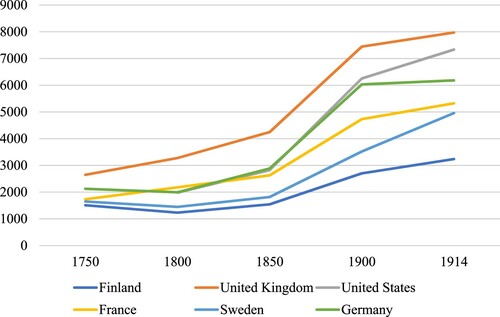
Figure 2. Map of the North (from Dufour and Dyonnet, 1863), Kungliga Biblioteket Stockholm.
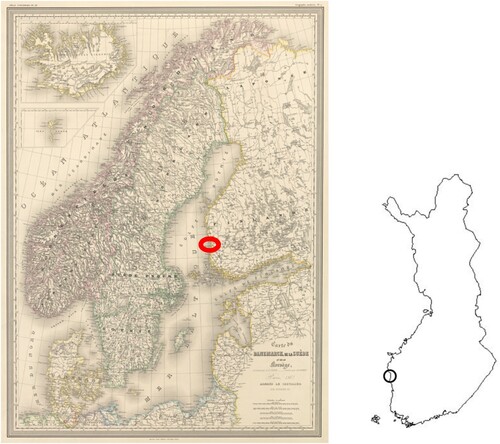
Figure 3. Histogram of probated decedents’ age at death (older than 20 years old) in both Kristinestad and Lapväärtti, 1850–1914. Source: the dataset.
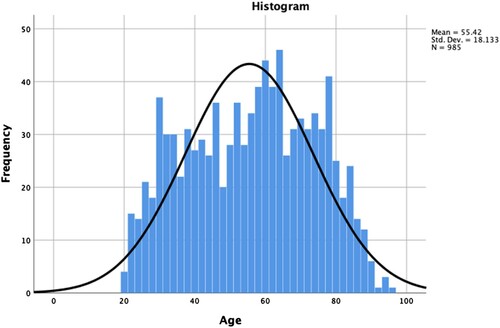
Figure 4. Distribution of promissory notes by value in Kristinestad and Lappfjärd, 1850–1914. Source: the dataset.
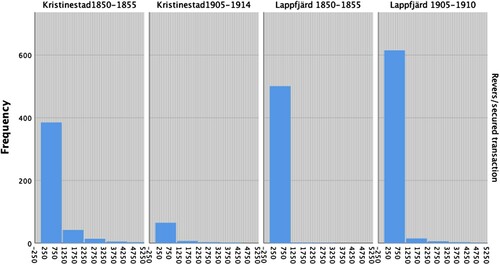
Table 1. Overview of the probate inventories in Kristinestad and Lappfjärd, 1850–1914.
Table 2. Decedents and their total wealth in Kristinestad and Lappfjärd, 1850–1914.
Table 3. Breakdown of the probate sample by sex and marital status in Kristinestad and Lappfjärd, 1850–1914.
Table 4. Distribution of decedents by age in Kristinestad and Lappfjärd 1850–1914.
Table 5. Decedents according to their socio-professional status in Kristinestad and Lappfjärd, 1850–1914.
Table 6. Descriptive statistics of credit relations in Kristinestad and Lappfjärd, 1850–1914 (markka 1914).
Table 7. Overview of the nature of the claims and liabilities of the decedents in Kristinestad and Lappfjärd, 1905–1914.
Table 8. Overview of the promissory notes in Kristinestad and Lappfjärd, 1850–1914.
Figure 5. Network of promissory notes in Kristinestad and Lappfjäard in 1850–5. Nodes are coloured according to their geographical origins (Red for Lappfjäard and Green for Kristinestad) and weighted according to their out-degree. Source: the dataset.
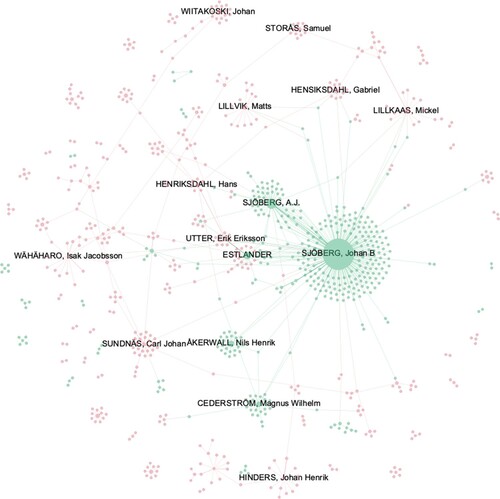
Table 9. Relations between creditors and debtors in Kristinestad and Lappfjärd using promissory notes, 1850–1914.
Figure 6. Network of promissory notes and bank loans in Kristinestad and Lappfjärd in 1905–14. Nodes are coloured according to their geographical origins (Red for Lappfjärd and Green for Kristinestad) and weighted according to their out-degree. Source: the dataset.
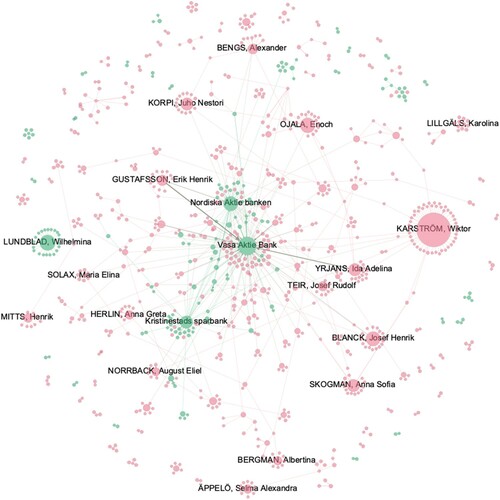
Figure 7. Network of promissory notes and bank loans in Kristinestad and Lappfjärd in 1905–14. Nodes are coloured according to their geographical origins (Red for Lappfjärd and Green for Kristinestad) and weighted according to their eigenvector centrality measure. Source: the dataset.
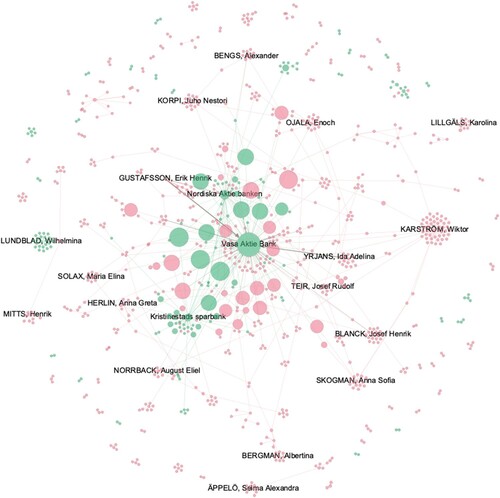
Table 10. Distribution of depositor facilities across banking institutions in Finland, 1870–1913.
Table 11. Overview of bank loans and deposits in Kristinestad and Lappfjärd, 1850–1914.
Table 12. Estimation of the living population’s interaction with banking institutions in Kristinestad and Lappfjärd, 1905–1914.
Figure 8. Banking institutions’ network in Kristinestad and Lappfjärd, 1905–14. The nodes are weighted according to their out-degree and coloured according to their modularity class. Source: the dataset.
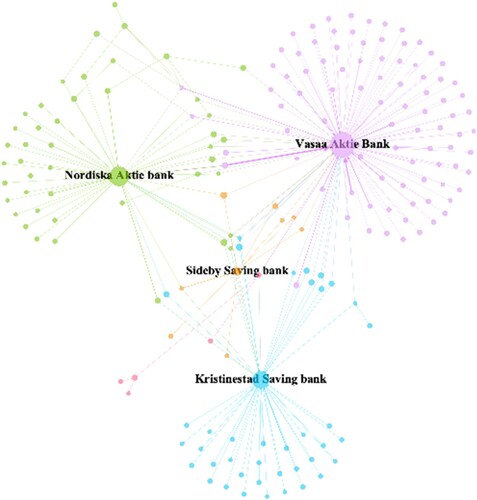
Figure 9. Banks and their clients in Kristinestad and Lappfjärd, 1905–14 (coloured by socio-professional categories and weighted according to their degree). Source: the dataset.
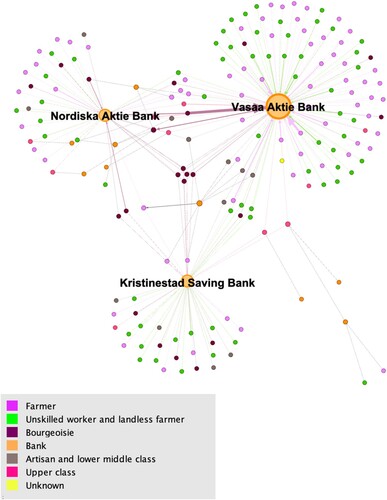
Table A1. Estimation of the living population’s bank loans and bank deposit accounts in Kristinestad and Lapväärtti, 1905–14 (annual average).
Table A2. Estimation of the living population’s bank deposit holders in Kristinestad and Lapväärtti according to the socio-professional repartition, 1905–14.
Table A3. Estimation of the living population with a bank loan in Kristinestad and Lapväärtti according to the socio-professional repartition, 1905–14. Living population estimation based on Bengtsson et al. (Citation2019).