
Figures & data
Table 1. Match rates.
Table 2. Origin and destination provinces for rural-to-urban migrants. Row = 100%.
Table 3. Origin and destination provinces for rural-to-rural migrants. Row = 100%.
Table 4. Distribution of rural-rural and rural-urban migration flows by distance.
Figure 1. Shares of non-migrants, rural migrants and urban migrants by father's social status.
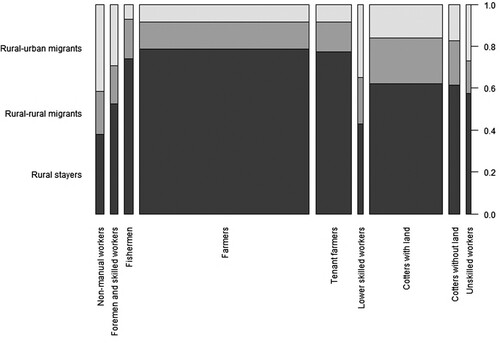
Figure 2. Distribution of sons’ occupational HISCAM statuses in 1900 by their migration status and parental occupational status.
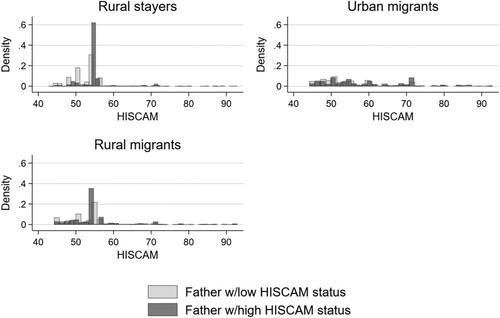
Table 5. Top 5 son’s occupations and their shares in 1900 by father’s lower and higher occupational status. HISCAM score in parentheses. Rural-rural migrants and rural-urban migrants.
Table 6. A summary of determinants of occupational status and migration equations.
Figure 3. Distribution of sons’ expected occupational gains by their migration status and parental occupational status.
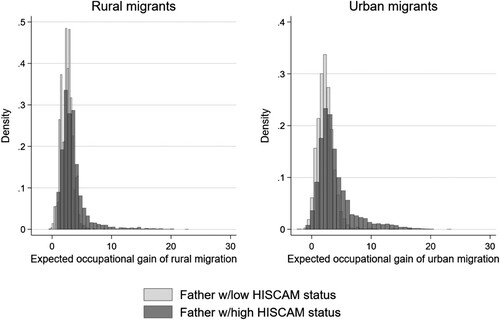
Table 7. Maximum likelihood results: determinants of occupational status attainment and rural-urban migration.
Table 8. Self-selection on observables in migration.
Table A1. Summary statistics of 1865 characteristics in the final matched sample and population.
Table A2. Sample means and standard deviations for rural-urban migrants, rural-rural migrants and rural stayers.