
Figures & data
Figure 1. Top income shares in Malmö, 1900, 1920 and 1950. Note. Individual-level calculation. Based on Bengtsson, Molinder and Prado’s (Citation2022) national dataset, which includes a random sample of taxpayers in Malmö. The calculations for 1900 and 1920 include imputing an income of 400 kr for non-taxpayers.
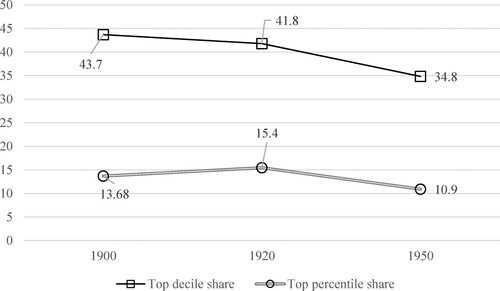
Table 1. Share of coverage in the tax records for Södervärn and Möllevången in 1905 and 1920.
Table 2. Mean incomes of the top 10, middle 40 and bottom 50 in 1900, 1920 and 1950.
Table 3. Income per social group, 1900–1950.
Table 4. The incomes of the working class in Malmö, 1920 and 1950, real terms.
Figure 2. Income differentials by worker group, 1920 and 1950. Note. Calculations based on random sample; see . 1900 is not included since domestic workers and low-paid workers more generally rarely paid tax in this year.
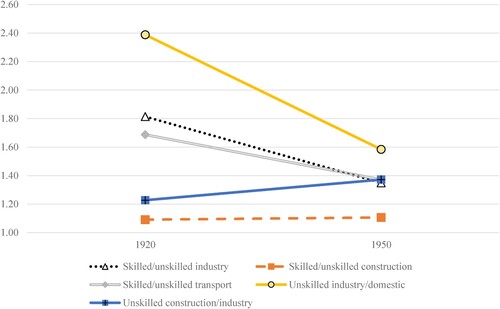
Table 5. The real incomes of the working class in Malmö, 1905, 1920, 1935 and 1950 from the strategic sample.
Table 6. Share of women in worker groups, 1920 and 1950 (random sample).
Table 7. Incomes and income differences per social group on the household level.
Table 8. Income ratios before and after tax.
Table 9. Professional composition of the top 25 incomes every year
Table A1. Effects on the mean income in 1935 by enlarging the sample.
Table B1. Median income per social group, 1905–1950: strategic sample.
Table B2. Median nominal/real income in the four districts of Malmö 1905–1950.
Table B3. The composition of the working class: taxonomy with 1920 examples.