
Figures & data
Table 1. Summary of basic definitions.
Figure 1. Income share of the top 1 per cent in the Nordic countries, 1865–2017.
Note: Data for Denmark from Atkinson and Søgaard (Citation2016), Finland from Roikonen (Citation2022), Norway from Aaberge and Atkinson (Citation2010) and Aaberge et al. (Citation2020), Sweden from Roine and Waldenström (Citation2010, tab 7.A.2).
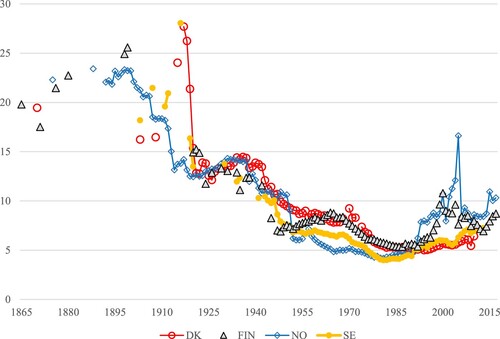
Figure 2. Estimates of the Gini coefficient in the Nordic countries, 1865–2018.
Note that the y-axis is cropped at 0,30. Source for Denmark is Atkinson and Søgaard (Citation2016), mean of the upper bound and the lower bound series. Source for Finland is Roikonen (Citation2022), 60 per cent assumption for non-filers. Roikonen’s data cover the 1866–2004 period; for 2005–2019 we have extrapolated the Gini from the 2004 level using the changes in the OSF Gini estimates also included in Roikonen’s dataset. Source for Norway is Aaberge et al. (Citation2020), displayed as mean of upper and lower bounds. Source for Sweden is SCB, ‘Indikatorer inkomstfördelning, disponibel inkomst och faktorinkomst per konsumtionsenhet, familjeenheter, 1975–2013 , 2020-års priser’.
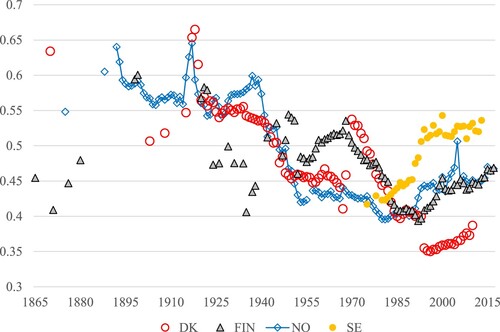
Table 2. Summary of the evolution of overall income inequality.
