
Figures & data
Figure 1. Contemporary critique of the distribution of relief.
Source: Picture from the newspaper Fäderneslandet (14 December 1867), criticising the disproportionate quantities of relief that supposedly disappeared into the pockets of middlemen.
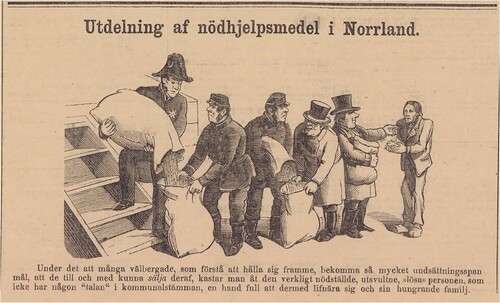
Figure 2. Deaths in Västerbotten, 1866–1870. Source: BiSOS, serie H, 1866–1870, p. 2.
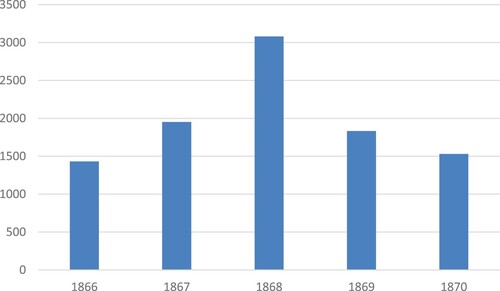
Figure 3. National and regional comparison of mortality rates in Finland and Sweden.
Source: Statistics Finland, Crude death rate. 1751–2021; Forsberg et al. (Citation1977), p. 245; Nelson (Citation1988); BiSOS, serie A. Befolknings-statistik 1866–1870.
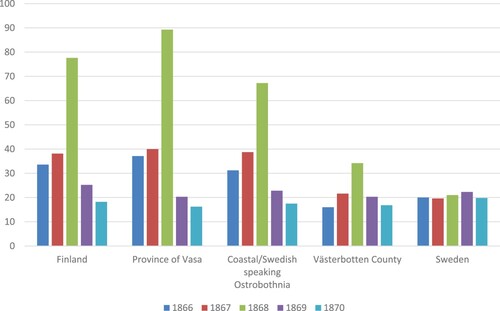
Figure 4. Harvests in Västerbotten, 1860–1870.
Note: 0 = total harvest failure; 1 = almost total harvest failure; 2 = meagre harvest; 3 = below or almost average harvest; 4 = average harvest; 5 = better-than average-harvest; 6 = good harvest (Hellstenius, Citation1871, pp. 77–119).
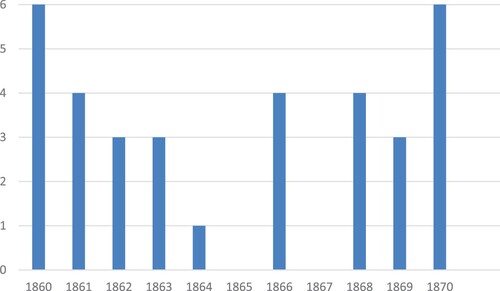
Figure 5. Incoming grain and flour to Västerbotten, 1866–1870.
Source: BiSOS, serie H, 1866–1870, p. 4.
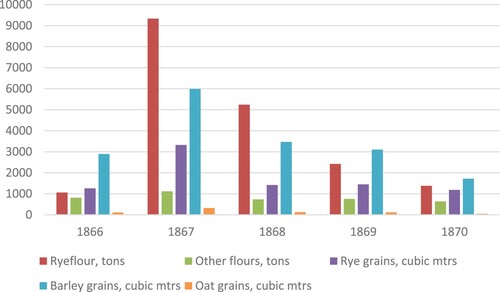
Figure 6. The administration of famine relief in Västerbotten in the 1860s. The illustration can be compared to Nelson’s (Citation1988, p. 123) findings concerning Norrbotten, to acknowledge regional differences.
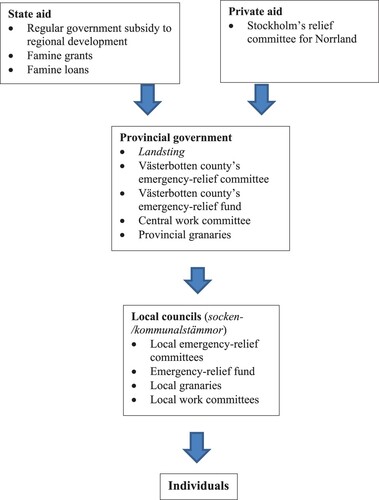
Table 1. Financial state aid for harvest failure given to Västerbotten county, 1862–1867 (riksdaler riksmynt).
Table 2. Municipal expenses, including poor relief, in Västerbotten, 1866–1870 (riksdaler riksmynt).