
Figures & data
Figure 1. Phases of data collection and participant numbers.
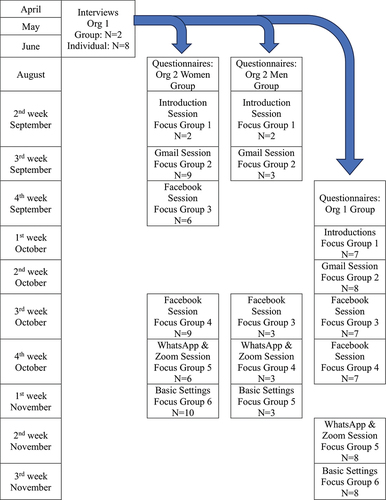
Figure 2. Funnel filter strategy.
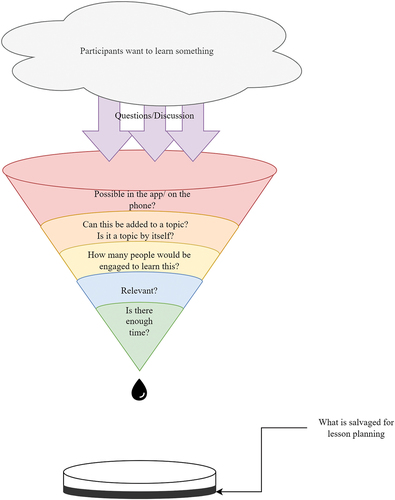
Figure 3. Feedback spiral strategy.
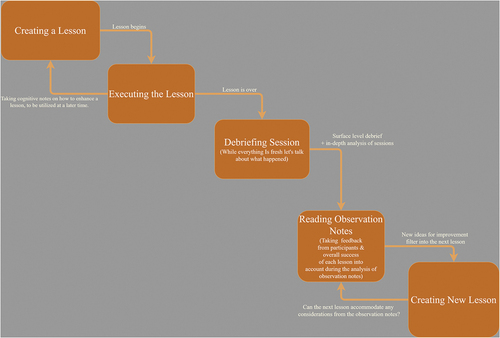
Table 1. DigComp key quotes and associated learning activities.
Table 2. Socio-demographic characteristics of all participants (n = 31).
Table 3. Results on senior technology acceptance using STAM of phase 2 participants (n = 21).
Table 4. Results on mobile device proficiency using MDPQ-16 of phase 2 participants (n = 21).
Table 5. Applications and associated objectives for each learning session.
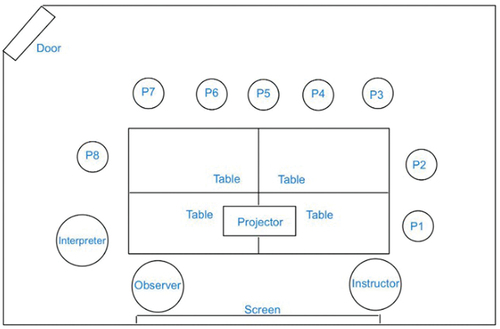
Figure 4. Visual sketch of classroom layout.
Supplemental material