2,905
Views
0
CrossRef citations to date
0
Altmetric
Research Article

Abstracts from the 10th European Regional ISSX Meeting

Pages 1-172 | Published online: 02 Dec 2008

Figures & data

Figure 1 Prediction of weight related MDZ systemic CL by incorporating either hyperbolic (A) or biphasic (B) CYP3A4 ontogeny patterns into the overall PBPK model. Solid squares plus error bars are in vivo data, grey symbols are PBPK models predictions, solid line is median prediction and dashed line 5th and 95th percentile.
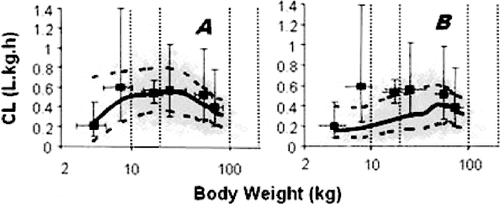
Figure 1  Prediction of weight related MDZ systemic CL by incorporating either hyperbolic (A) or biphasic (B) CYP3A4 ontogeny patterns into the overall PBPK model. Solid squares plus error bars are in vivo data, grey symbols are PBPK models predictions, solid line is median prediction and dashed line 5th and 95th percentile.

Table 1 Predicted vs. observed PK parameters

Table 2 Predicted vs. observed PK parameter ratios for different formulations

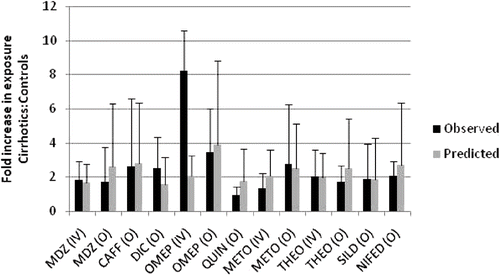
Figure 1 Comparison of fold increases in exposure -: cirrhosis vs healthy controls (mean ± SD).

Figure 1  Comparison of fold increases in exposure -: cirrhosis vs healthy controls (mean ± SD).

Table 1 The effect of test compounds on the accumulation (hepatocytes), BEI and Clbiliary of d8-taurocholate as a percentage of control (no inhibitor)
Reprints and Corporate Permissions

Please note: Selecting permissions does not provide access to the full text of the article, please see our help page How do I view content?

To request a reprint or corporate permissions for this article, please click on the relevant link below:

Academic Permissions

Please note: Selecting permissions does not provide access to the full text of the article, please see our help page How do I view content?

Obtain permissions instantly via Rightslink by clicking on the button below:

If you are unable to obtain permissions via Rightslink, please complete and submit this Permissions form. For more information, please visit our Permissions help page.