Figures & data
Figure 1. 3D culture models of primary human liver cells constitute versatile tools for a multitude of applications in toxicology and pharmacology. Different 3D culture paradigms have been presented that are compatible with the culture of human hepatocytes or hepatocyte-like cells in mono-culture or in co-culture with non-parenchymal liver cells (NPCs). Figure modified with permission from Lauschke et al. (Citation2019).
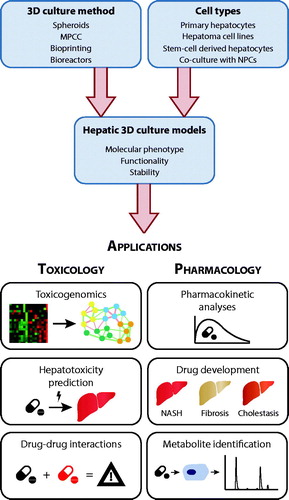
Table 1. Advantages and limitations of commonly used human hepatic cell models for toxicological studies.
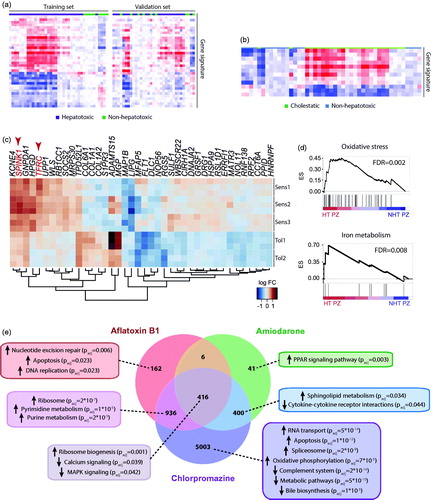
Figure 2. Toxicogenomic studies in human hepatic cells can identify hepatotoxic compounds and delineate underlying toxicity mechanisms. (a) Heatmap showing a gene expression signature of 36 genes in HepG2 cells that can distinguish hepatotoxic from non-hepatotoxic compounds. The signature was identified in the training set and replicated reasonably well in a separate set of validation compounds. (b) Furthermore, using a separate signature of 12 genes, HepG2 cells could distinguish between cholestatic and non-hepatotoxic compounds. Panels a and b were adapted with permission from Van den Hof et al. (Citation2014). Copyright 2014 American Chemical Society. (c) Heatmap visualization of a gene expression signature in patient-derived HLCs from three patients sensitive (Sens1-3) and two patients tolerant (Tol1-2) to pazopanib. Transcripts highlighted in red TFRC and SPINK1 are related to iron metabolism. (d) Gene set enrichment analysis (GSEA) for genes related to oxidative stress (top panel) or iron metabolism (bottom panel) in cells for which pazopanib was toxic (HT PZ) compared to nontoxic (NHT PZ). ES = enrichment score. Panels c and d were modified with permission from Choudhury et al. (Citation2017). (e) Venn diagram showing the number of differentially expressed genes (FDR < 0.05) in primary human hepatocyte spheroids exposed to hepatotoxins with different toxicity mechanisms compared to vehicle controls. GSEA indicates compound-specific and overlapping toxicity responses. Panel e modified with permission from Bell et al. (Citation2017).