
Figures & data
Figure 1. Workflow of haze digestion experiments.
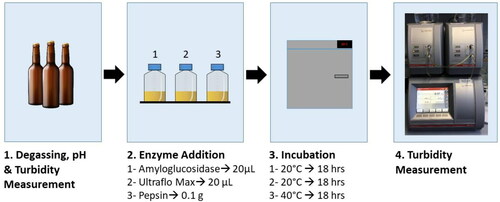
Figure 2. Comparison of pre- and post-digestion values of amyloglucosidase, pepsin, and Ultraflo® Max in control, normal, and high haze beer utilizing EBC units. The dotted line represents the value at which samples were classified as high haze. Normal haze samples contained n = 7 brews, high haze samples contained n = 5 brews, and control samples contained n = 2 brews. Error bars indicate one standard deviation.
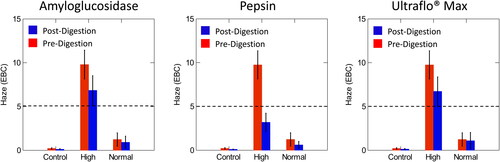
Figure 3. Comparison of pre- and post-digestion values of amyloglucosidase, pepsin, and Ultraflo® Max in control, normal and high haze beer measured at a 25° angle compared to the light axis. The dotted line represents the value at which samples were classified as high haze. Normal haze samples contained n = 7 brews, high haze samples contained n = 5 brews, and control samples contained n = 2 brews. Error bars indicate one standard deviation.
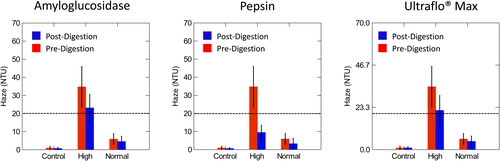
Figure 4. Comparison of pre- and post- digestion values of amyloglucosidase, pepsin, and Ultraflo® Max in control, normal, and high haze beer measured at a 90° angle compared to the light axis. The dotted line represents the value at which samples were classified as high haze. Normal haze samples contained n = 7 brews, high haze samples contained n = 5 brews, and control samples contained n = 2 brews. Error bars indicate standard deviation.
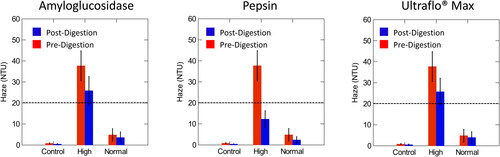
Table 1. Averages, standard deviation (S.D.), and p-values obtained from a paired t-test of normal/low haze pre- and post-digestion values (n = 7 brews).
Table 2 . Averages, standard deviation (S.D.), and p-values obtained from a paired t-test of high haze pre- and post-digestion values (n = 7 brews).
Table 3. Averages, standard deviation (S.D.), and p-values obtained from a paired t-test of control haze pre- and post-digestion values (n = 7 brews).
Table 4. ANOVA of the differences in turbidity values, post-digestion, of high, normal, and control beer samples after each enzyme treatment at each angle of incidence measured.
Figure 5. Concentration of total proteins in control, high, and normal haze samples with corresponding p-values calculated by Tukey’s Significant Different Test. Normal haze samples contained n = 7 brews, high haze samples contained n = 5 brews, and control samples contained n = 2 brews. Error bars indicate one standard deviation.
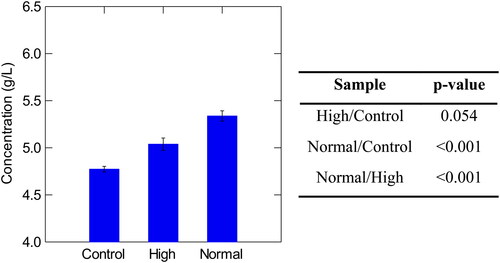
Figure 6. Concentration of total polyphenols in control, high, and normal haze samples with corresponding p-values Tukey’s Significant Different Test. Normal haze samples contained n = 7 brews, high haze samples contained n = 5 brews, and control samples contained n = 2 brews. Error bars indicate one standard deviation.
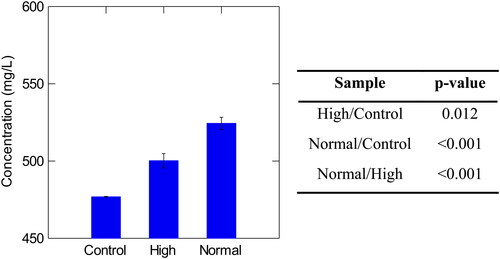
Figure 7. Concentration of high molecular weight β-glucans in control, high, and normal haze samples with corresponding p-values Tukey’s Significant Different Test. Normal haze samples contained n = 7 brews, high haze samples contained n = 5 brews, and control samples contained n = 2 brews. Error bars indicate one standard deviation.
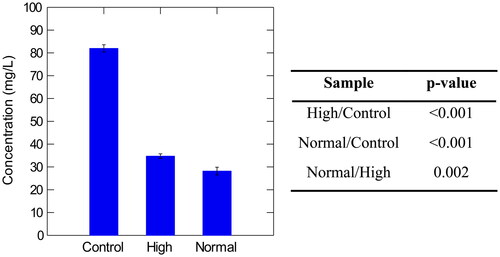
Table 5. Average values of high molecular weight β-glucan, total polyphenol, and total protein in normal, high, and control samples with corresponding standard deviations (S.D.).
Figure 8. Molecular organization of Saccharomyces cerevisiae cell wall adapted from Klis et al. and Lipke and Ovall.[Citation22,Citation23] The mannoprotein is orange and N-linked or O-linked oligosaccharides are blue. The intercellular β-glucan is in the box and chitin is inside the cell.
![Figure 8. Molecular organization of Saccharomyces cerevisiae cell wall adapted from Klis et al. and Lipke and Ovall.[Citation22,Citation23] The mannoprotein is orange and N-linked or O-linked oligosaccharides are blue. The intercellular β-glucan is in the box and chitin is inside the cell.](/cms/asset/ed16de8e-8711-4304-8711-fbcaf688b5dd/ujbc_a_1937460_f0008_c.jpg)