Figures & data
Table 1. Multiple reaction monitoring parent-daughter ion pairs.
Figure 1. Hop yield. The yield of wet hops in grams from each bine for the 2018 (Panel A) and 2019 (Panel B) harvests. Error bars represent the standard deviation of the samples for 2018 (n = 10 per treatment) and 2019 (n = 6 per treatment). No statistically significant differences were found between treatments within harvest years (α = 0.05).
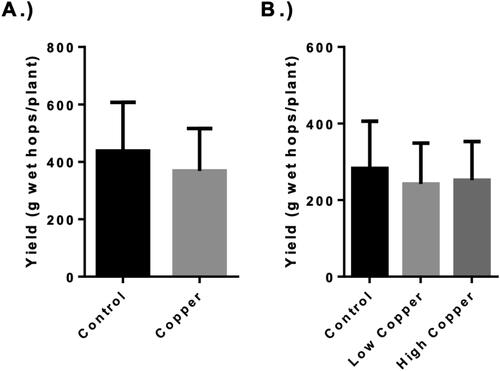
Figure 2. Hop elemental analysis. The elemental analysis of dried hop cones from the 2018 (Panel A and B) and 2019 (Panel C and D) seasons. Copper was significantly elevated in copper-based fungicides (CBF)-treated hops regardless of season and treatment frequency. Error bars represent the standard deviation of the samples for 2018 (n = 10 per treatment) and 2019 (n = 6 per treatment). Difference in single elemental content between treatments was evaluated by the Student’s two-sample t test for 2018 data (* indicates a significant difference, p < 0.05) and using a one-way analysis of variance (ANOVA) with Tukey’s HSD post hoc test for the 2019 data (significant differences are indicated by dissimilar letters above the bar, p < 0.05).
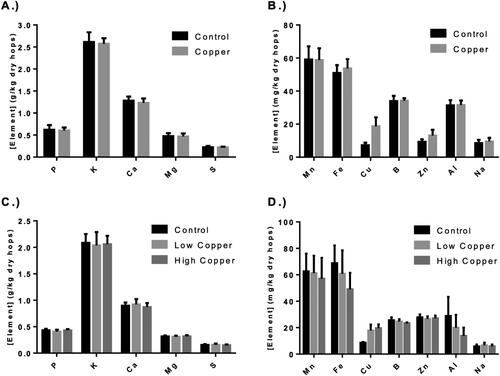
Figure 3. The α-acid and β-acid content of copper-based fungicides (CBF)-treated hops. Pooled and individual acid analysis of hops from 2018 (Panel A and B) and 2019 (Panel C and D) expressed as weight percent of hops analyzed. Error bars represent the standard deviation of the samples for 2018 (n = 10 per treatment) and 2019 (n = 6 per treatment). Difference in acid content between treatments was evaluated by the Student’s two-sample t test for 2018 data and using a one-way analysis of variance (ANOVA) for the 2019 data. No significant differences in individual acids or pooled humulones and lupulones were observed between treatments in either harvest year.

Figure 4. Hop essential oil profiles of copper-based fungicides (CBF)-treated hops. Essential oil component concentration expressed as internal standard equivalents (2-octanol) for the 2018 (Panel A) and 2019 (Panel B) seasons. Error bars represent the standard deviation of the samples for 2018 (n = 10 per treatment) and 2019 (n = 6 per treatment). Difference in terpenoid content between treatments was evaluated by the Student’s two-sample t test for 2018 data and using a one-way analysis of variance (ANOVA) for 2019. No significant differences in the quantified essential oil compounds were observed between treatments regardless of CBF-application frequency or harvest year.
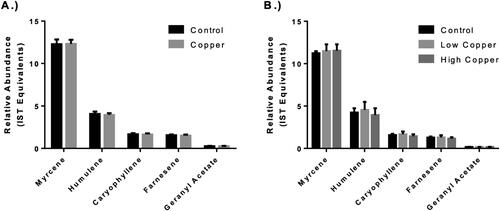
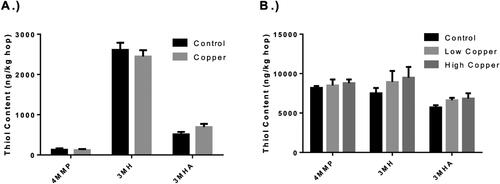
Figure 5. Hop thiol content of copper-based fungicides (CBF)-treated hops. 4-Mercapto-4-methylpentan-2-one (4MMP), 3-mercaptohexanol (3MH), and 3-mercaptohexyl acetate (3MHA) of hops from 2018 (Panel A) and 2019 (Panel B) expressed as ng/kg. Error bars represent the standard error of the mean for 2018 (n = 10 per treatment) and 2019 (n = 6 per treatment). Difference in individual thiol between treatments was evaluated by the Student’s two-sample t test for 2018 data and using a one-way analysis of variance (ANOVA) for the 2019 data. No significant differences in the quantified thiols were observed between treatments regardless of CBF-application frequency or harvest year.