
Figures & data
Table 1. Total number of genotypes (#G), number of blue genotypes (#B) identified by color values measured via colorimeter (bB, see materials and methods) in the 2021 season of the present study, and proportion of blue genotypes (#B/#G) for each family observed in this study.
Figure 1. Pearled grain used in the scoring of aleurone color with dark blue receiving a 1, blue receiving a 2, medium or light blue receiving a 3, and white receiving a 4.
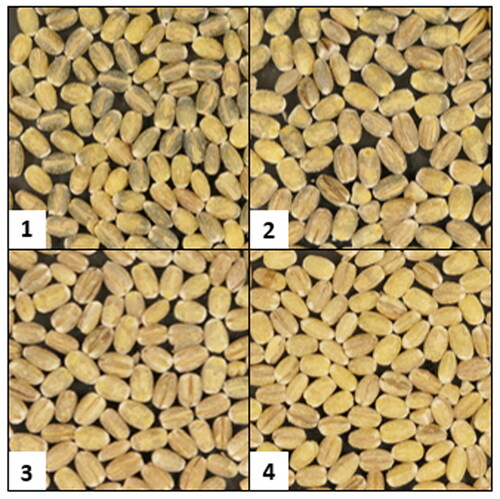
Table 2. Results from the ANOVA and variance component estimation of the across-year values.
Figure 2. Distributions of the bB colorimeter value across all genotypes of the Cycle 5 Panel in the 2021 harvest season (A) and the 2022 harvest season (B). Check genotypes are indicated and labeled in red.
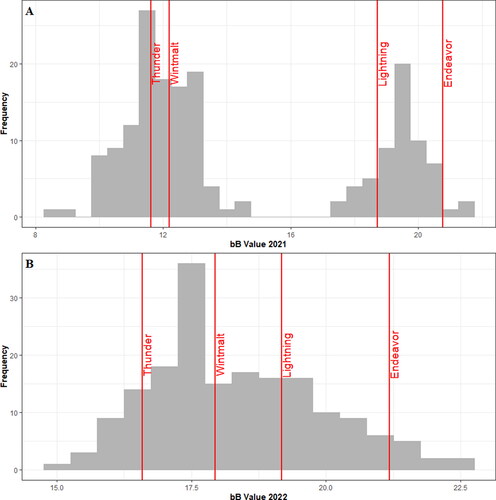
Figure 3. Pearson correlation matrix relating the different measures of grain aleurone color. All values were recorded in 2021 at minimum, with the LB, aB, and bB values also collected in 2022.
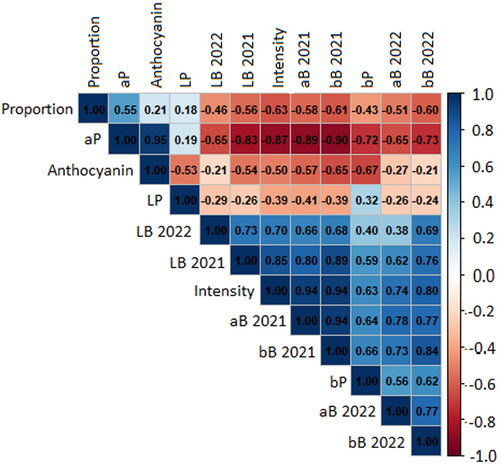
Figure 4. Pearson correlation matrices relating the bB value of grain aleurone color, and ten of the malting parameters measured in this study. The left matrix shows correlations across the entire Cycle 5 population. The right matrix shows only the correlations within the DH120304/Flavia pedigree.
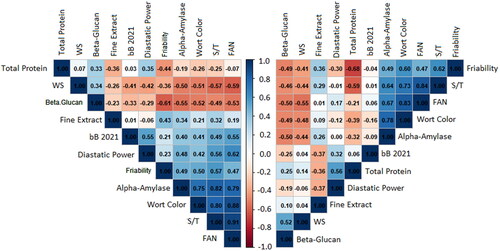
Figure 5. Boxplots of A) S/T, B) DP, C) FE, and D) BG broken out by the observed aleurone color from the 2021 harvest season. Letters at the base of each plot are the result of a Fisher’s LSD Test to detect significant differences between groups. A jitter plot is overlaid on each boxplot to show exact data values. The Fisher’s Test for beta-glucan is based on values transformed via Box-Cox transformation to account for non-normality; however, the displayed data values are untransformed.
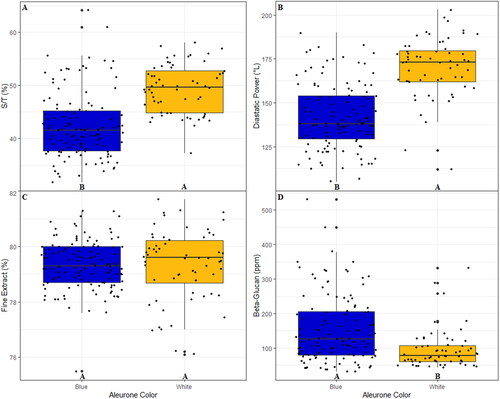
Table 3. Results from the ANOVA and Fisher’s LSD test comparing the performance of each observed aleurone color group with regards to ten of the measured malting traits.
Figure 6. A scatterplot plotting anthocyanin content against the measured bB value in 2021. Point shapes are based on the visual score for blue aleurone with squares indicating light blue, triangles indicating blue, and circles indicating dark blue.
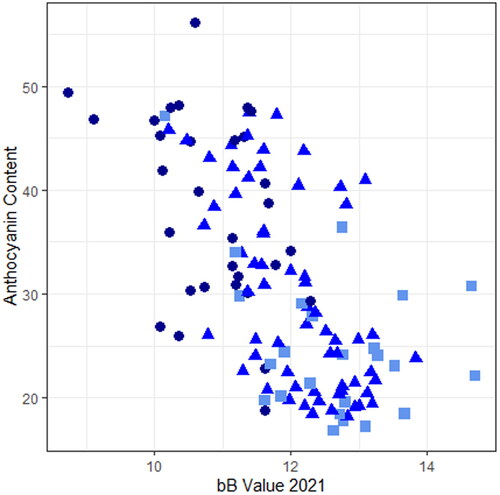
Figure 7. Boxplots of A) S/T B) DP, C) FE, and D) BG broken out by the observed aleurone color from the 2021 harvest season within the DH120304/Flavia Pedigree. Letters at the base of each plot are the result of a Fisher’s LSD Test to detect significant differences between groups. A jitter plot is overlaid on each boxplot to show exact data values. The Fisher’s Test for beta-glucan is based on values transformed via Box-Cox transformation to account for non-normality; however, the displayed data values are untransformed.
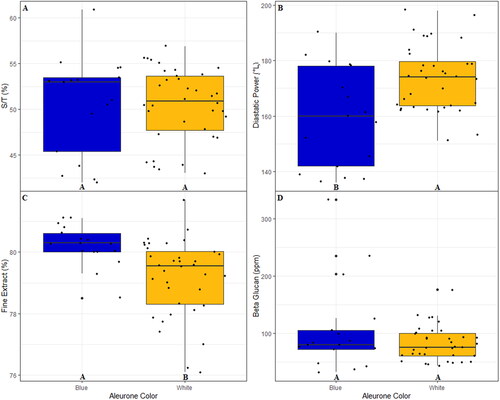
Table 4. Results from the ANOVA and Fisher’s LSD test comparing the performance of the blue and white aleurone color groups within the DH120304/Flavia subset.
Figure 8. Manhattan plots with a significance threshold resulting from the GWAS analysis showing significant peaks for the aleurone color traits A) bB as measured from the 2021 harvested grain, B) bB as measured from the 2022 harvested grain, C) intensity of blue aleurone measured from the 2021 harvested grain, and D) proportion of grains with blue aleurone measured from the 2021 harvested grain.
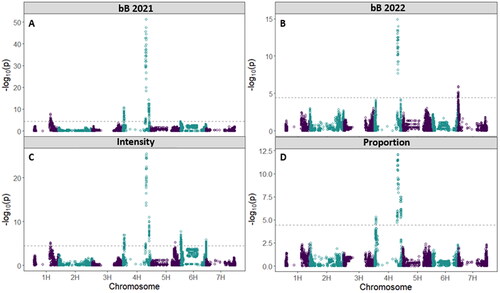
Figure 9. Manhattan plots with a significance threshold resulting from the GWAS showing significant peaks for the malting traits A) FAN, B) WC, C) S/T, and D) AA.
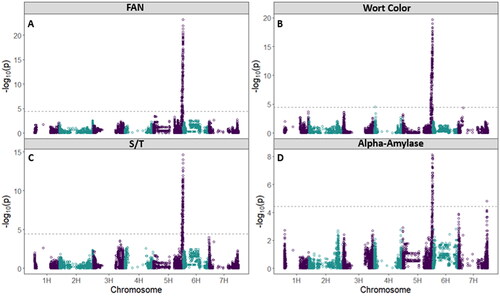
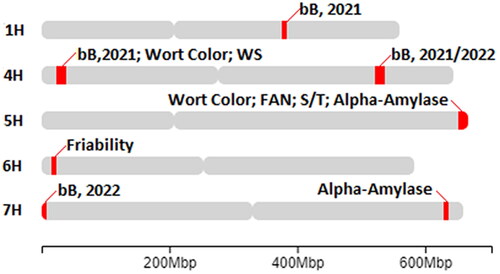
Figure 10. A subset of malt and aleurone color QTL mapped to their respective positions on the barley genome. The position outlined in red is of the most significant marker for a given peak. Trait associated with each QTL as well as the year identified are provided.
Supplemental Material
Download PNG Image (34.5 KB)
Supplemental Material
Download PNG Image (92.5 KB)
Supplemental Material
Download PNG Image (78.2 KB)
Supplemental Material
Download MS Excel (22.1 KB)Data availability
Phenotypic data will be available on the Triticae Toolbox T3/Barley.