
Figures & data
Figure 1. Beers before and after foaming.
A can of beer (brand B) stored in a refrigerator (5° C) was removed at room temperature (20° C). Samples of 50 mL (1) or 65 mL (2) of beer were transferred to a measuring container and bubbled by ultrasonic waves for 2 min in an ultrasonic washing machine.
(I) Before foaming and (II) after foaming.
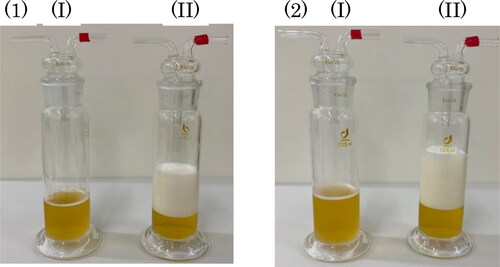
Figure 2. A proton-transfer-reaction time-of-flight mass spectrometer with a dynamic and reactive flavor-release monitoring system.
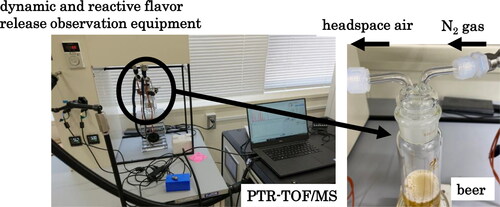
Figure 3. The behavior of orthonasal aroma components of 65 mL beer A sample before and after foaming.
(1) m/z 43.0542, (2) m/z 45.0355, (3) m/z 57.0699, (4) m/z 60.0525, (5) m/z 71.0855, (6) m/z 89.1050, (7) m/z 131.1067, (8) m/z 145.2139, (9) m/z 173.1536, (10) m/z 201.1848
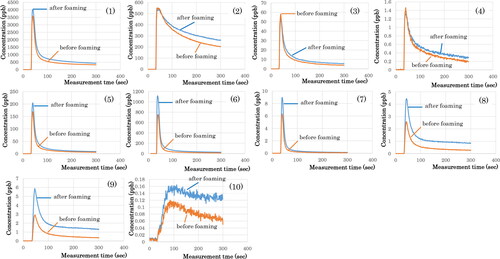
Figure 4. The behavior of orthonasal aroma components of 65 mL beer B sample before and after foaming.
(1) m/z 43.0542, (2) m/z 45.0355, (3) m/z 57.0699, (4) m/z 60.0525, (5) m/z 71.0855, (6) m/z 89.1050, (7) m/z 131.1067, (8) m/z 145.2139, (9) m/z 173.1536, (10) m/z 201.1848

Table 1. Target compounds in beer.
Figure 5. Comparison of the amount of headspace aroma components in 65 mL beer A sample with and without foaming.
The integral values of the concentration of each aroma component from 100 to 300 s of measurement are shown.
(1) m/z 43.0542, (2) m/z 45.0355, (3) m/z 57.0699, (4) m/z 60.0525, (5) m/z 71.0855, (6) m/z 89.1050, (7) m/z 131.1067, (8) m/z 145.2139, (9) m/z 173.1536, (10) m/z 201.1848
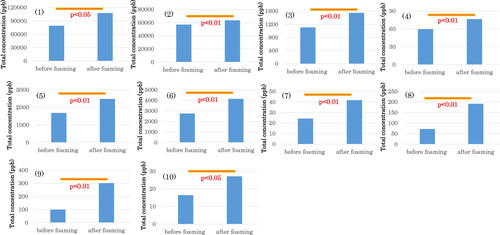
Figure 6. Comparison of the amount of headspace aroma components in 65 mL beer B sample with and without foaming. The integral values of the concentration of each aroma component from 100 to 300 s of measurement are shown.
(1) m/z 43.0542, (2) m/z 45.0355, (3) m/z 57.0699, (4) m/z 60.0525, (5) m/z 71.0855, (6) m/z 89.1050, (7) m/z 131.1067, (8) m/z 145.2139, (9) m/z 173.1536, (10) m/z 201.1848
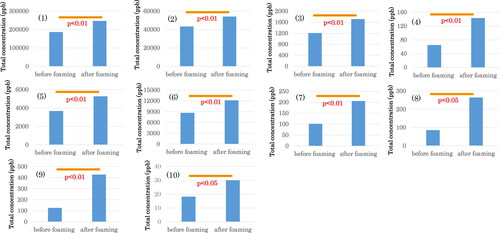
Figure 7. The behavior of headspace aroma component concentration ratio in 50 mL (1), 65 mL (2), and 75 mL (3) samples of beer A before and after foaming.
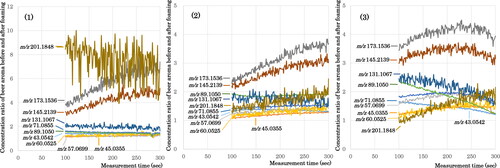
Figure 8. The behavior of headspace aroma component concentration ratio in 50 mL (1), 65 mL (2), and 75 mL (3) samples of beer B before and after foaming.
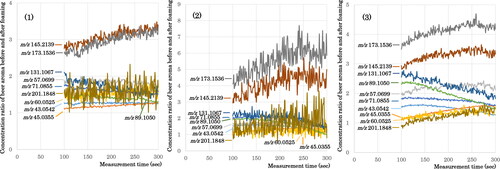
Figure 9. The headspace volume concentration ratio by foaming. Each value was calculated as I volume/II volume.

Figure 10. The behavior of the headspace aroma component content ratio in 50 mL (1), 65 mL (2), and 75 mL (3) samples of beer A before and after foaming.
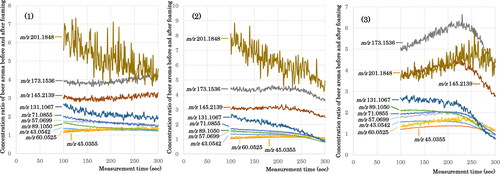
Figure 11. The behavior of the headspace aroma component concentration ratio in 50 mL (1), 65 mL (2), and 75 mL (3) samples of beer B before and after foaming.
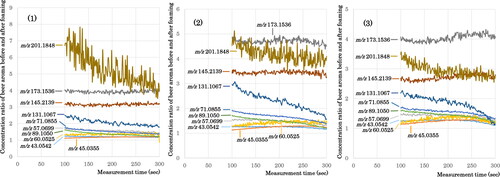
Figure 12. Relationship between the headspace aroma component concentration ratio of 65 mL beer A (1) or B (2) samples before and after foaming and the partition coefficient of the aroma component.
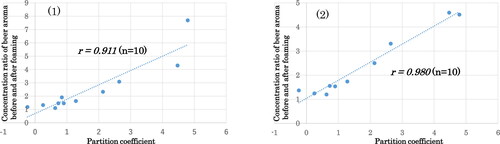
Figure 13. Diagram of the high distribution coefficient aroma components in the gas-liquid interface of beer foam. The figure was drawn with reference to the Summary of AIST press release on August 10, 2018[Citation9] and the report by Suzuki.[Citation6]
![Figure 13. Diagram of the high distribution coefficient aroma components in the gas-liquid interface of beer foam. The figure was drawn with reference to the Summary of AIST press release on August 10, 2018[Citation9] and the report by Suzuki.[Citation6]](/cms/asset/0e3650bf-2563-4425-a966-403e9136761c/ujbc_a_2215686_f0013.jpg)