
Figures & data
Table 1. Culture media composition and suppliers.
Figure 1. Enniatin (ENN) concentration in control (F. tricinctum alone) and co-culture (F. tricinctum + E. gerundensis) experiments in liquid medium. Panel A: Co-culture between F. tricinctum 2399 and E. gerundensis 6E4; Panel B: Co-culture between F. tricinctum 2502 and Erwinia gerundensis 6E4. Histograms (mean ± standard deviation) with different letters (a, b, c) are significantly different (p < 0.05). *Total ENN refers to the sum of enniatins A, A1, B, and B1.
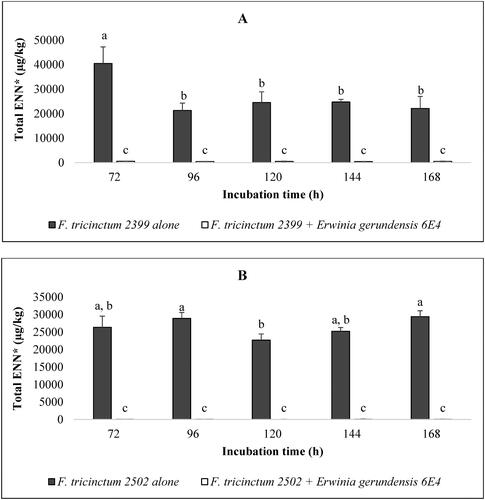
Table 2. Biomass and enniatin concentrations during co-culture on barley kernels. For total ENN, values (mean ± standard deviation) with different letters (a, b, c, d) are significantly different (p < 0.05).
Figure 2. Relative abundance of E. gerundensis (EG) throughout the malting process. Expressed in number of reads of EG sequences per a total of 23136 reads. M1: no EG treatment; M2: barley treated with 4 x 10¹⁰ CFU EG/kg; M3: Barley treated with 4 x 10⁷ CFU EG/kg; M4: barley treated with 4 x 10⁴ CFU/kg; Seed: unmalted barley.
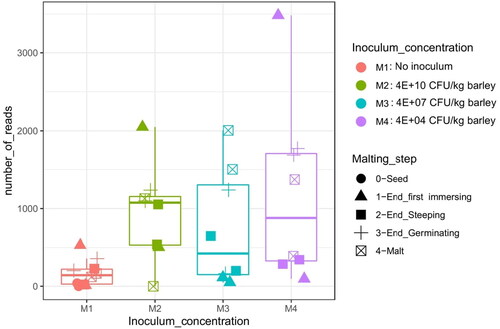
Figure 3. Effect of E. gerundensis on the total fungal load of malt. Error bars represent the standard error.
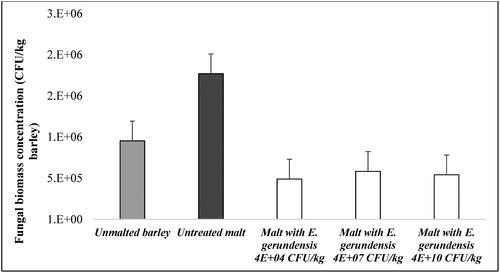
Figure 4. Effect of E. gerundensis (EG) on mycotoxin content of malt. A: ENN; B: DON; C: DON3G; D: T2 + HT2 toxins. Error bars represent the uncertainty of the LC-MS/MS method (15%).
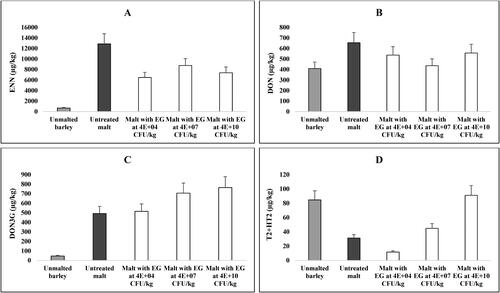
Table 3. Technological quality of malted barley with different doses of E. gerundensis (EG) applied before steeping.
Table 4. Effect of E. gerundensis on the mycotoxin content of malt. Values (mean ± standard deviation) with the same letters are not significantly different (p > 0.05).
Table 5. Effect of E. gerundensis on the technological quality parameters of malt. Values (mean ± standard deviation) with different letters are significantly different (p < 0.05).