
Figures & data
Table 1. Quality parameters of Pilsner malt selected for this study.
Figure 1. pH values at mashing-in (black) and in the final mash (grey). Results represent mean value and standard deviation (n = 3). Measurements were carried out at 63 °C. One-way analysis of variance (ANOVA) with Tukey post-hoc test at p < 0.05 was used for statistical evaluation. Statistically distinguished groups for samples whose pH was measured at mashing-in were labelled with upper case letters, whereas groups for samples whose pH was measured in the sweet wort were labelled with lower case letters.
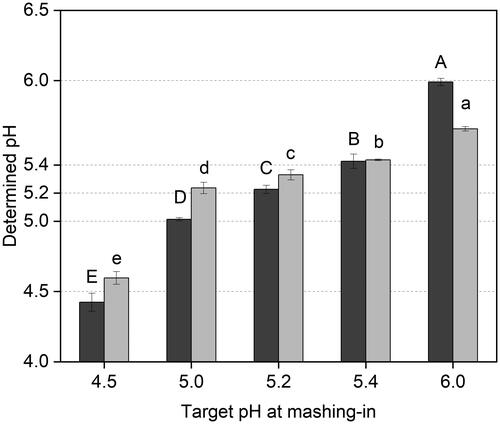
Figure 2. Extract and fermentable sugars content in sweet wort as a function of mashing-in pH measured at 63 °C. The following symbols represent means and standard deviations (n = 3) for maltose (red circles), glucose (black diamonds), maltotriose (blue squares), and extract content (green triangles).
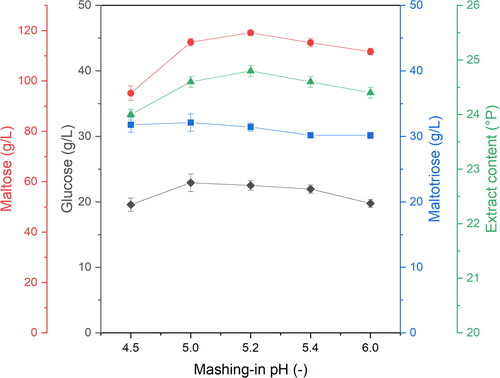
Table 2. Limit dextrins in sweet worts produced at varying mash pH conditions.
Table 4. Levels of free amino acids and soluble proteins at varying mash pH conditions.
Figure 3. Levels of transition metal ions as a function of pH in the sweet wort at mashing-off. pH in the final sweet wort was measured at 63 °C. The symbols represent mean values (n = 3) for Fe (black squares), Mn (blue triangles), Zn (green diamonds), and Cu (red circles). The corresponding color filling represent the error bands.
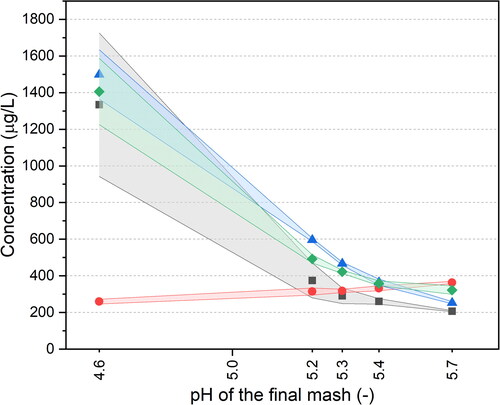
Figure 4. ESR-determined rate of radical formation as a function of pH in the sweet worts produced at varying pH conditions. The pH of the sweet wort was measured at 63 °C. Linear regression fitting is represented by the line. Capital letters (A, B, C) indicate statistically distinguished groups by one-way analysis of variance (ANOVA) with a Tukey post hoc test at p < 0.05.
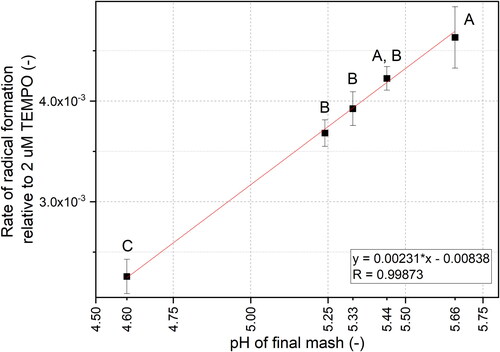
Figure 5. Rates of oxygen consumption at 25 °C in sweet worts as a function of final mash pH. The pH of the sweet worts were measured at 63 °C. Results represent means and standard deviations (n = 3).
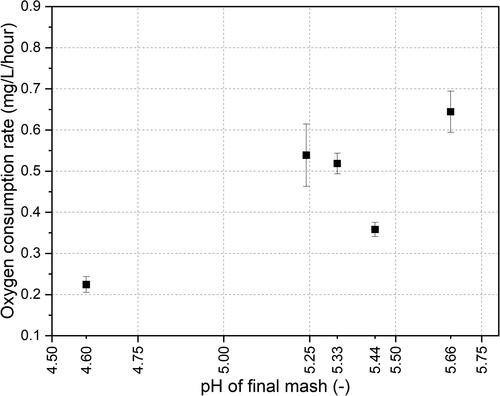
Figure 6. Effect of pH adjustment in the final wort on the electron spin resonance (ESR)-determined oxidative parameters. Scheme on the left represent the pH adjustment of the final sweet wort used for the evaluation of the pH-effect on the determined ESR oxidative properties of worts. pH was measured at 63 °C. Each pH adjustment was carried out in triplicate. The bar graph on the right represents the rate of radical formation in sweet wort in reference samples and pH-adjusted sweet wort samples. Statistical significance evaluated at p < 0.05.
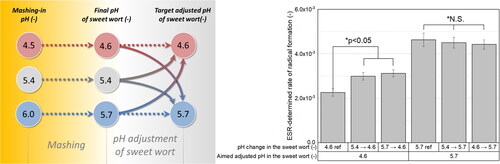
Figure 7. Volatile aldehydes as a function of mashing-in pH. The pH was determined at mashing-in at 63 °C. The values for the determined aldehyde levels represent means and standard deviations (n = 3). Capital letters (A, B) represent statistically distinguished groups by one-way analysis of variance (ANOVA) with Tukey post-hoc test at p < 0.05.
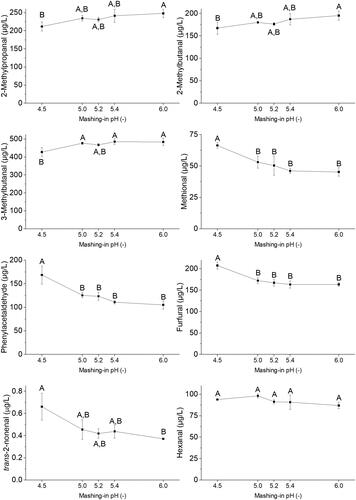
Table 3. Wort color, total polyphenols, flavonoids, proanthocyanidins and FRAP reducing potential of the sweet worts produced at varying mash pH conditions. Capital letters in the superscripts (A, B, C) indicate statistically distinguished groups by one-way analysis of variance (ANOVA) with a Tukey post hoc test at p < 0.05.