Figures & data
Figure 1. The formation of fatty acid hydroperoxides and trihydroxy fatty acids through enzymatic lipid oxidation (lipase, lipoxygenase (LOX), and autoxidation [adapted from Refs.[Citation28,Citation29]]).
![Figure 1. The formation of fatty acid hydroperoxides and trihydroxy fatty acids through enzymatic lipid oxidation (lipase, lipoxygenase (LOX), and autoxidation [adapted from Refs.[Citation28,Citation29]]).](/cms/asset/db1f0b5d-9057-4dc6-9b44-108eb5420906/ujbc_a_2338609_f0001_c.jpg)
Figure 2. Particle size distribution of each corn grits sample by shaking sieve analysis. Data are the mean of three independent measurements.
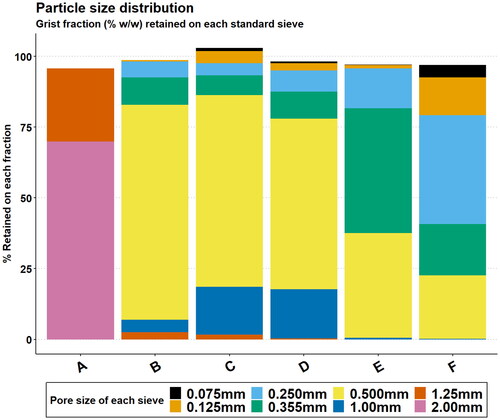
Table 1. Analytical data for the fresh corn grits samples.
Figure 3. Lipid content % m/m (db) for each corn grits sample analysed across each time-point of analysis and storage temperature. a–cSuperscripts represent the ANOVA post-hoc groupings across each sample individually, p < 0.05.
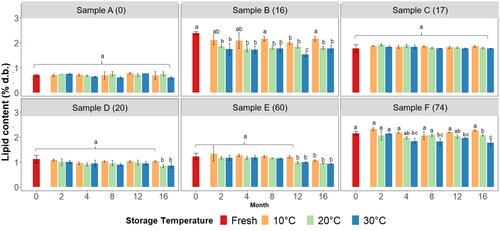
Figure 4. Trihydroxy fatty acid (THFA) concentration for each corn sample analysed across each time-point of analysis and storage temperature. a–cSuperscripts represent the ANOVA post-hoc groupings across storage of each sample individually, p < 0.05.
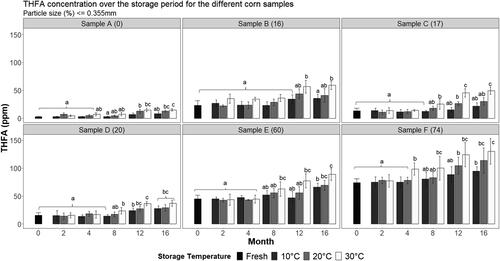
Figure 5. Trihydroxy fatty acid (THFA) concentrations across all time points of analysis (at all storage temperatures) for each corn sample analysed.
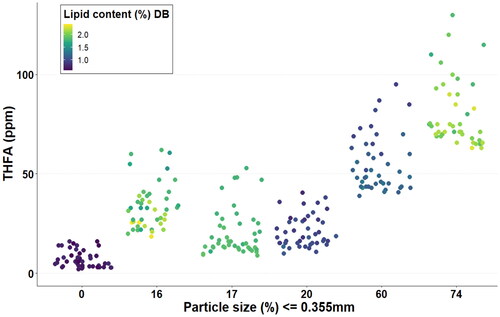
Figure 6. The relative importance of the predictor variables in the 5-component PLS-R model for THFA concentrations reported in ; % particle size distribution ≤0.355 mm (PS), storage time (month), temperature (temp), lipid content (lipid), and Fe content.
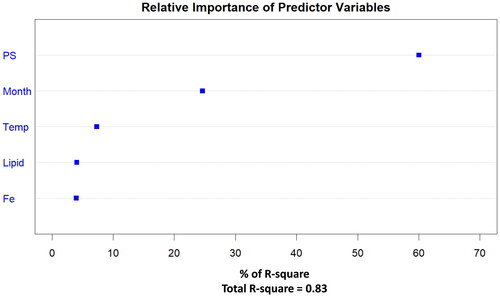
Table 2. PLS-R models relating THFA concentration to temperature, time (month), iron, % particles ≤0.355 mm (PS) and lipid content.
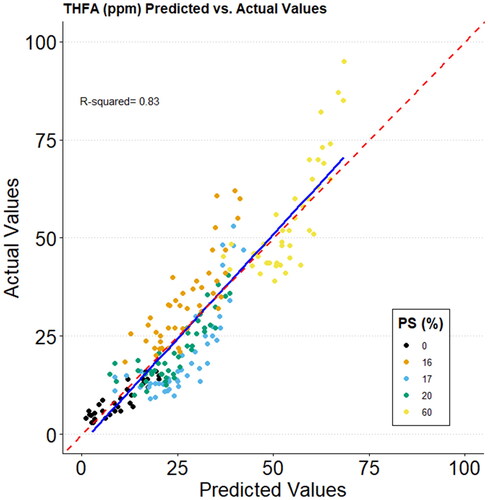
Figure 7. Regression plot of the PLS-R model for the prediction of THFA levels obtained at various levels of particle size distribution, storage time and temperature, lipid content and iron content. PS (%) refers to the % of particle size distribution ≤0.355 mm. Red dashed line: Perfect fit; blue line: Trend line (R2 = 0.83).