
Figures & data
Table 1. Overview of the demographic characteristics of the YA and OA groups and performance on the neuropsychological test by the OA group.
Figure 1. Examples of items in the first and second order affective ToM, cognitive ToM, and physical control conditions (color figure online).
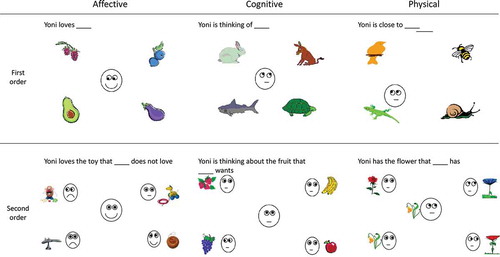
Figure 2. Individual median RTs and mean median RTs (adjusted for performance in the physical control condition) for the affective and cognitive ToM components as a function of age group in the first (left) and second (right) order conditions. Error bars represent within-subject standard errors. * p <.05 ** p <.01 *** p <.001.
Figure 3. Individual and mean proportion of correct responses (adjusted for performance in the physical control condition) for the affective and cognitive ToM components as a function of age group in the first order (left) and second order (right) conditions. Error bars represent within-subject standard errors.
Table 2. Correlations between performance measures (RT and proportion of correct responses) for each of our experimental conditions as a function of Age group.