
Figures & data
Table 1. Sociodemographic and clinical characteristics of the analytical sample.
Figure 1. Bivariate correlations between depressive symptoms and other variables. Spearman rho for significant correlations (p < .05) are reported.
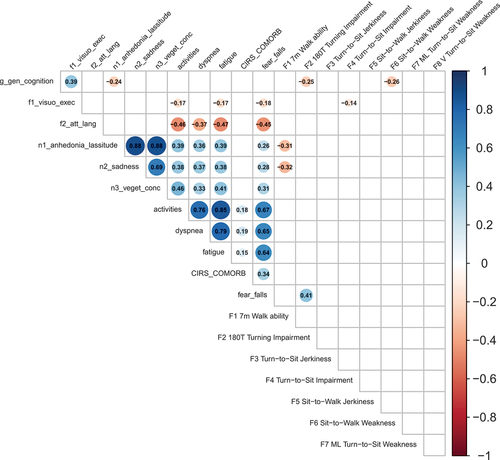
Figure 2. Network analysis of depression and somatic dimensions. The thickness of the line between two nodes is proportional of the strength of the association; green and red presents positive and negative correlations, respectively.
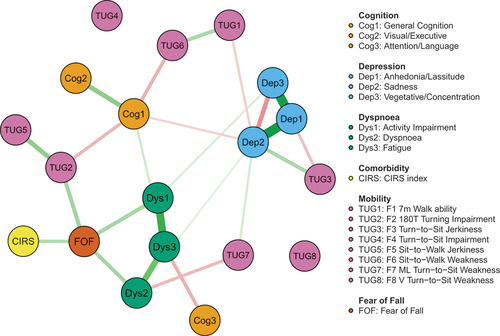
Table 2. Weighted adjacency matrix of the network model.
Figure 3. Centrality measures of strength and expected influence.
Supplemental material