Figures & data
Figure 1. Trial of the Color Match Game. The meaning of the left word (always displayed in black) and both meaning and display color of the right word (displayed in red in this example) change independently between trials. A color version of this figure is available in the online version.
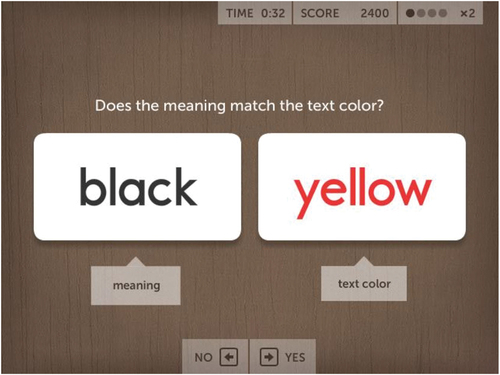
Table 1. Trial Types in the Color Match Game.
Table 2. Sample Size.
Figure 2. Summary Statistics for Response Times Across Age Groups, Practice Levels and Trial Types. Error bars indicate 95 percent confidence intervals.
Figure 3. Summary Statistics for Accuracies Across Age Groups, Practice Levels and Trial Types. Error bars indicate 95 percent confidence intervals.
Figure 4. Individual Congruency Effects per Age Group and Practice Level.
Table 3. Mean RT, Congruency Effect (SD in Parentheses) and Proportional Congruency Effect by Practice Level and Age Group.
Figure 5. Individual Congruency Effects on Accuracies per Age Group and Practice Level.
Table 4. Mean Congruency Effect on Accuracy ( in Parentheses) by Age Group and Practice Level.
Figure 6. Delta Plots per Age Group and Practice Level.
Table 5. Results of Fitting the Delta Plot with a Linear Function with Age Group and Practice Level as Covariates.
Figure 7. Lorenz-Interference Plots by Age Group and Practice Level. The dashed line marks the hypothetical uniform distribution of the interference over the RT distribution. A color version of this figure is available in the online version.
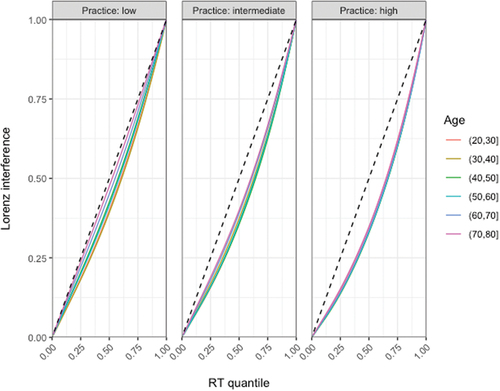
Figure 8. Interference Distribution Index (IDI) as a Function of Age Group and Practice Level. The IDI indicates the latency of the conflict on a scale from 0 to 1. Smaller IDIs indicate a larger congruency effect at longer RTs. Depicted are the means of 1000 bootstrap samples and the respective 95 percent confidence intervals.