Figures & data
Figure 1. Upper-left panel (a) shows hazard ratios from a flexible parametric proportional hazards model with 5 degrees of freedom (solid line) and a flexible parametric non-proportional hazards model with 5,3 degrees of freedom (dashed line) on the log cumulative hazard scale. Upper-right panel (b) shows the hazard ratios from flexible parametric non-proportional hazards models with varying degrees of freedom on the log cumulative hazard scale. Lower-left panel (c) shows the same as panel (a) but for models on the log hazard scale. Lower-right panel (d) shows the same as panel (b) but for models on the log hazard scale.
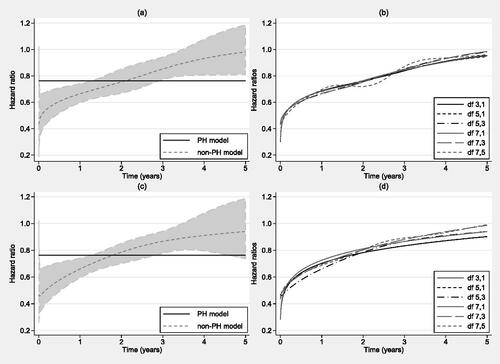
Table 1. Agreement of AIC and BIC with SKL for different models on the log cumulative hazard scale.
Figure 2. Survival proportions, hazard rates and log hazard ratios of the three simulated scenarios.
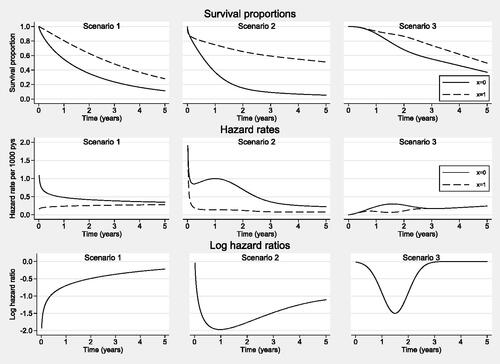
Table 2. Agreement of AIC and BIC with SKL for different models on the log hazard scale.
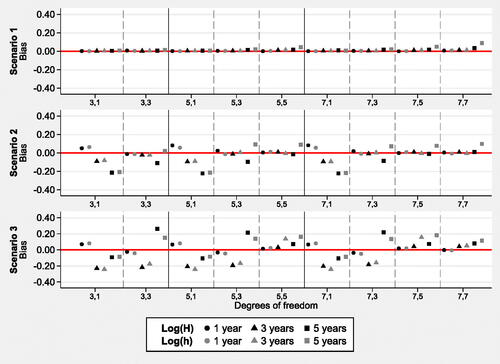
Figure 3. Bias in the survival proportions, from models on the log cumulative hazard, log(H), and log hazard, log(h), scales with different degrees of freedom. Sample size 1 000. Mean values based on 500 simulations.
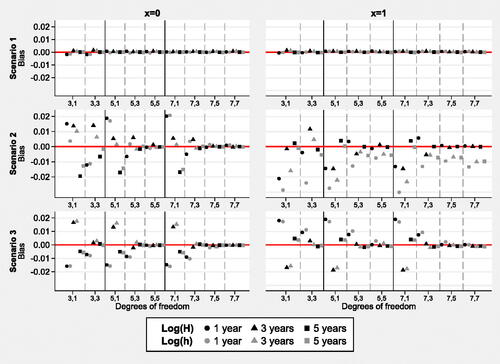
Figure 4. Bias in the hazard rates from models on the log cumulative hazard, log(H), and log hazard, log(h), scales with different degrees of freedom. Sample size 1 000. Mean values based on 500 simulations.
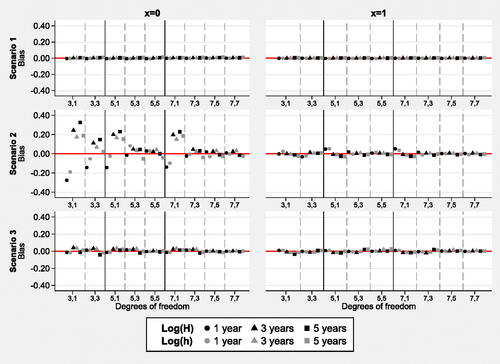
Figure 5. Bias in the survival proportions log hazard ratios from models on the log cumulative hazard, log(H), and log hazard, log(h), scales with different degrees of freedom. Sample size 1 000. Mean values based on 500 simulations.