
Figures & data
Table 1. Data description.
Figure 1. The graphical representation of a unidimensional and a multidimensional model with within-item and with between-item multidimensionality. The left panel represents the univariate model. The middle panel depicts a multidimensional model with within-item multidimensionality, and the right panel indicates a multidimensional model with between-item multidimensionality.
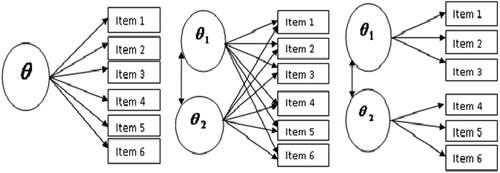
Figure 2. Depicts the poly-choric correlations of 16 questions. Assuming that there are latent continuous variables underlying the categorical variables which are normally distributed, poly-choric correlation estimates the correlation between the assumed underlying continuous variables. Blue color squares indicate positive correlation: a darker color means a stronger correlation. Light-pink color squares indicate a weak negative correlation.
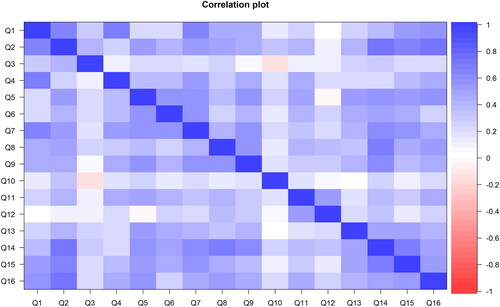
Table 2. Eigenvalue and explained variance for principal component analysis.
Table 3. Global fit statistic for each model up to 3 dimensions.
Table 4. P-values for likelihood ratio tests.
Table 5. Two- and three-factor solution for each model.
Figure 3. Item characteristic curves (ICCs) for factor 1. The black line represents the item curve of unidimensional 3PL + GR and red line represents the M4PL + MGR model.
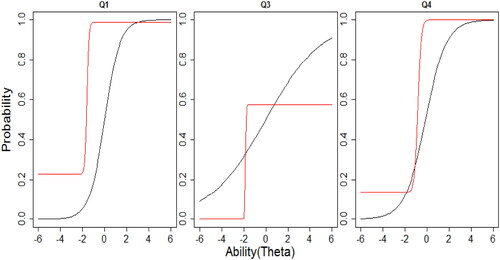
Figure 4. Item characteristic curves (ICCs) for factor 2. The black line represents the item curve of unidimensional 3PL + GR and red line represents the M4PL + MGR model.
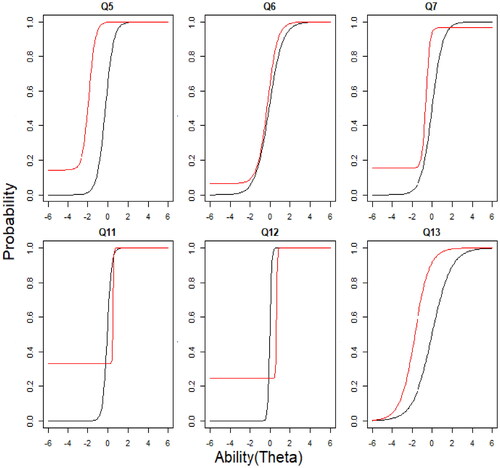
Figure 5. Item characteristic curves (ICCs) for dichotomous items in factor 3. The black line represents the item curve of unidimensional 3PL + GR and red line represents the M4PL + MGR model.
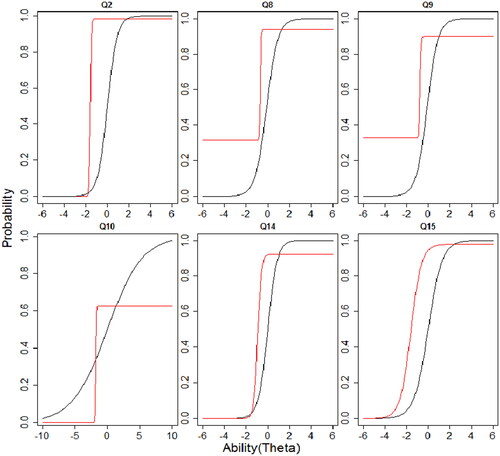
Figure 6. Item characteristic curves (ICCs) for graded response item Q16. The black line represents the item curve of unidimensional 3PL + GR and red line represents the M4PL + MGR model.
Figure 7. Data generation (simulation model, the true model) and data analysis (fitted model).
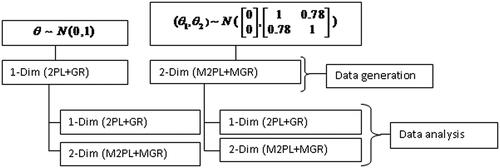
Table 6. Simulation results for discrimination parameter (mean RMSE, AB and bias over 16 items and 1000 simulation runs) and AIC (mean over 1000 simulation runs).
Table 7. Simulation results for difficulty parameter (mean RMSE, AB and bias over 16 items and 1000 simulation runs).
Data availability
The data that support the findings of this study are available from the corresponding author (Ul Hassan) upon reasonable request.