Figures & data
Figure 1. Monthly spatial point patterns of fatal traffic accidents in the city of London, UK, during 2013.
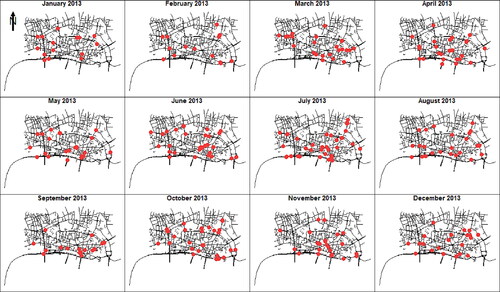
Figure 2. Monthly spatial point patterns of street crimes in the city of London, UK, during 2013.
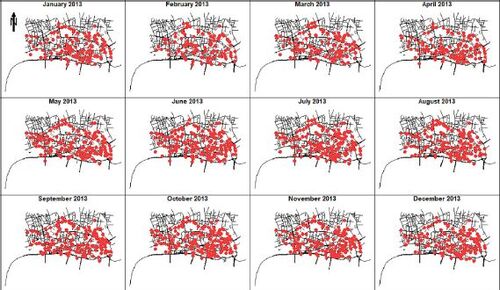
Figure 3. Monthly estimated intensities of the fatal traffic accident data in the city of London, UK, in 2013.
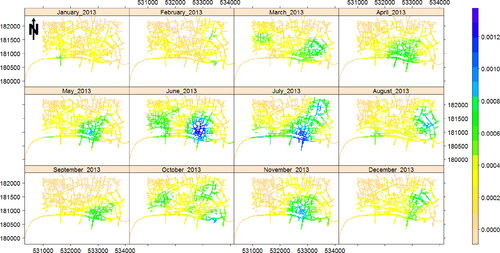
Figure 4. Monthly estimated intensities of the street crime data in the city of London, UK, in 2013.
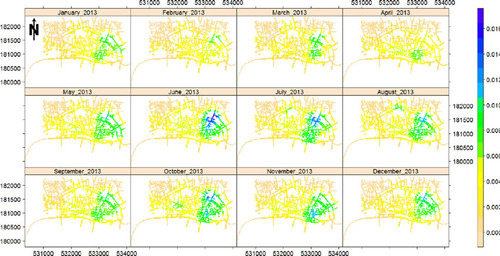
Figure 5. First lag partial autocorrelation for the time series of monthly estimated intensity and relative risk images of fatal traffic accident and street crime in the city of London, UK, in the period of January 2013 to December 2017.
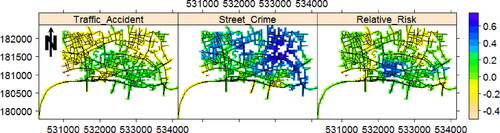
Figure 6. Detected pixels with significant trend based on the univariate Mann–Kendall test, at significance level 0.05, for the time series of monthly estimated intensity and relative risk images of fatal traffic accident and street crime in the city of London, UK, in the period of January 2013 to December 2017. Values represent the Kendall’s τ.
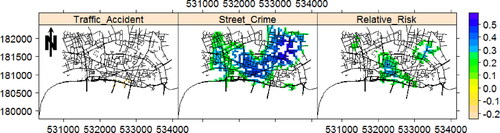
Figure 7. Average relative risk and estimated intensities, after aggregation and deseasoning, of the detected significant pixels by the Mann–Kendall method, at significance level 0.05, together with their locally weighted smooth regression lines.
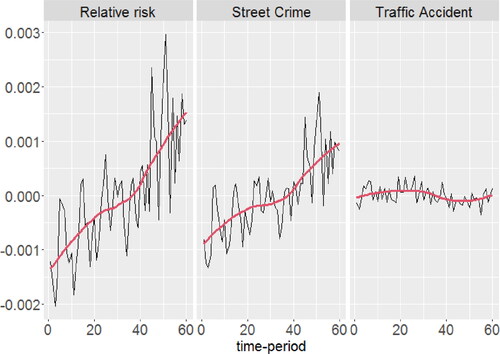
Figure 8. First lag partial autocorrelation for the time series of monthly estimated intensity images of different types of street crime in the city of London, UK, in the period of January 2013 to December 2017.
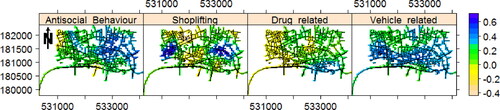
Figure 9. Detected pixels with significant trend based on the univariate Mann–Kendall test, at significance level 0.05, for the time series of monthly estimated intensity images of different types of street crime in the city of London, UK, in the period of January 2013 to December 2017.
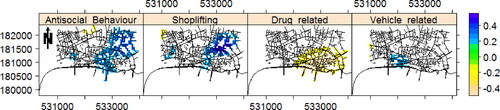
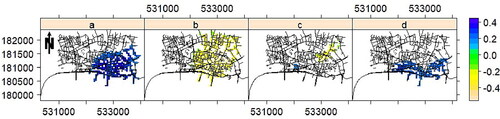
Figure 10. Detected pixels with significant trend based on the univariate Mann–Kendall test, at significance level 0.05, for the time series of monthly estimated relative risk images for antisocial vs. drug-related (a), drug-related vs. shoplifting (b), vehicle-related vs. shoplifting (c), and vehicle-related vs. drug-related (d) in the city of London, UK, in the period of January 2013 to December 2017.