Figures & data
Table 1. Abbreviations for each normality testing method.
Table 2. Simulation conditions: alternative distributions, sample sizes and significance levels.
Table 3. Empirical power: empirical power for various normality tests depending on sample size n under each alternative distribution at
Table 4. Empirical power: empirical power for various normality tests depending on sample size n under each alternative distribution at
Figure 1. The empirical distributions of p-values under and
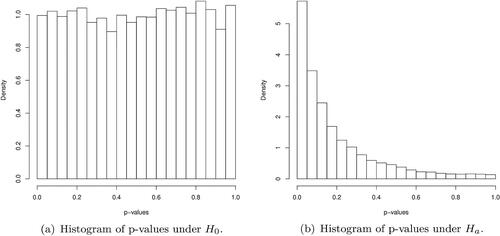
Table 5. Expected P-values: The expected value of the distribution of p-values for various normality tests depending on each sample size under each alternative distribution.
Table 6. Median P-values: The median value of the distribution of p-values for various normality tests depending on each sample size under each alternative distribution.
Figure 2. The distributional features of p-values when using Lilliefors’ modified Kolmogorov-Smirnov test statistic with varying sample size under the asymmetric alternative distributions. The dotted line and solid line are the expected value and the median value of the p-values, respectively.
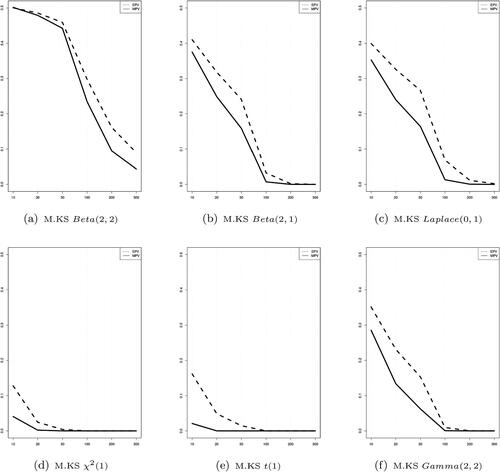
Figure 3. The distributional features of p-values when using Cramer von-Mises and Anderson-Darling test statistics with varying sample size under the asymmetric alternative distributions. The dotted line and solid line are the expected value and the median value of the p-values, respectively.
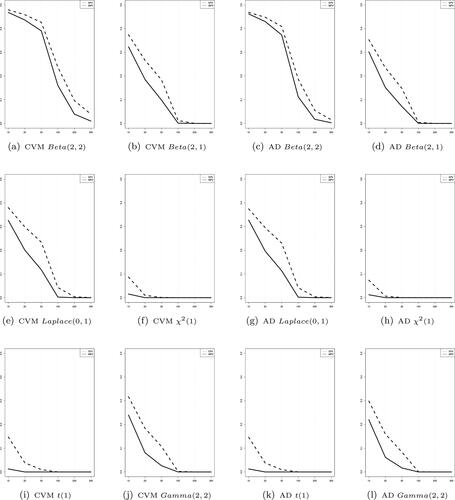
Figure 4. The distributional features of p-values when using Zhang-Wu test statistics with varying sample size under the asymmetric alternative distributions. The dotted line and solid line are the expected value and the median value of the p-values, respectively.
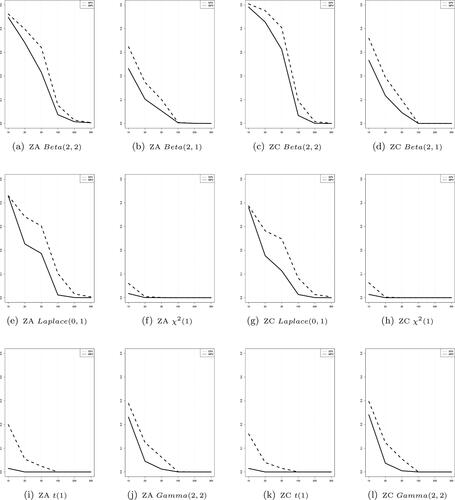
Figure 5. The distributional features of p-values when using Jarque-Bera and Gel-Gastwirth (R.JB) test statistics with varying sample size under the asymmetric alternative distributions. The dotted line and solid line are the expected value and the median value of the p-values, respectively.
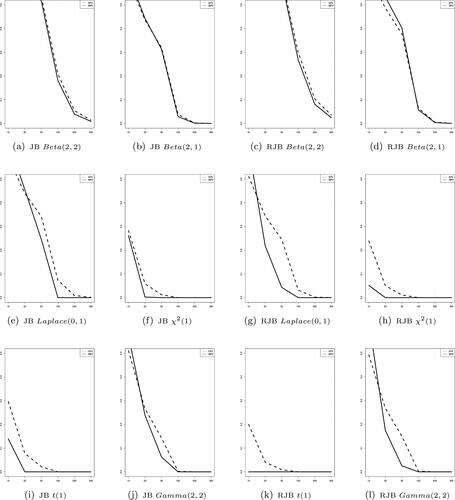
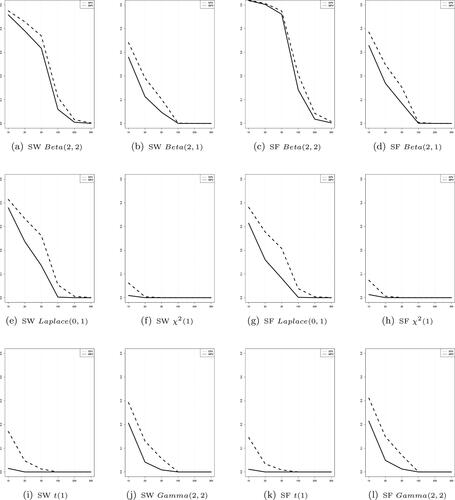
Figure 6. The distributional features of p-values when using Shapiro-Wilk and Shapiro-Francia test statistics with varying sample size under the asymmetric alternative distributions. The dotted line and solid line are the expected value and the median value of the p-values, respectively.