Figures & data
Table 1. Critical values for the tests based on the test statistics and
Table 2. Rejection rates (at the 5% level of significance) obtained by applying the tests (with ) based on the test statistics
(if
and
(if
respectively, to samples of size
from an ARFIMA(0,d,0)-GARCH(1,1) model with
distributed innovations and GARCH parameters α0 = 1, α1 = 0.1, β1 = 0.8999.
Table 3. Rejection rates (at the 5% level of significance) obtained by applying the tests (with ) based on the test statistics
(if
and
(if
respectively, to samples of size
from an ARFIMA(p,d,q)-GARCH(1,1) model with
distributed innovations, GARCH parameters α0 = 1, α1 = 0.1, β1 = 0.8999, and different values of (a) the AR parameter
and (b) the MA parameter
respectively.
Figure 1. Cumulative number of rejections with
α = 0.05 by tests based on
with
(a,c) and
with
(b,d): gold returns (bold in gold), DJIA returns (bold in magenta), synthetic ARFIMA(0,d,0)-series with
(red),
(orange),
(darkgray),
(green),
(blue).
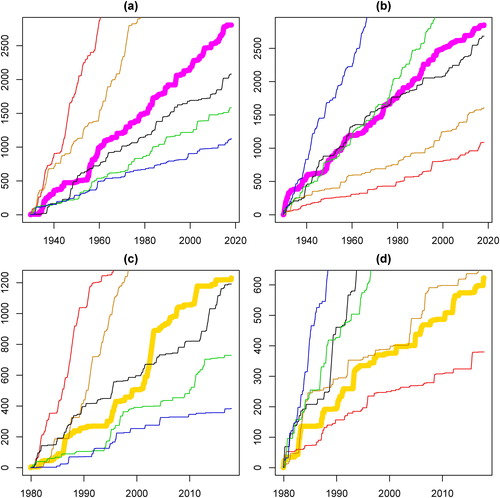
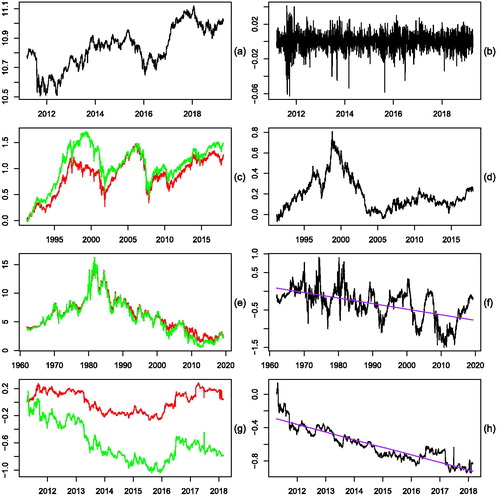
Figure 2. (a) Log Warsaw Stock Exchange Index, (b) Log returns, (c) Log Amsterdam Exchange Index (green) & log BEL 20 Index (red), (d) Difference, (e) 5 Year Treasury Yield Index (green) & 10 Year Treasury Yield Index (red), (f) Difference, (g) Log iShares Physical Gold ETC (green) & log iShares Silver ETC (red), (h) Difference.