Figures & data
Table 1. Values of β1, β2, and β3 used in the simulation study for values of θ corresponding to the 50th, 75th, and 95th percentile.
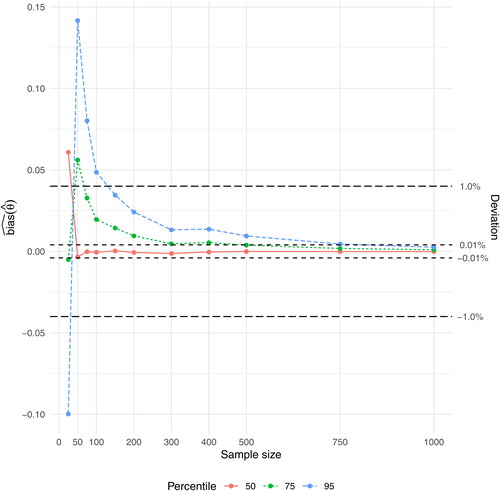
Figure 1. Graph of for the case
and
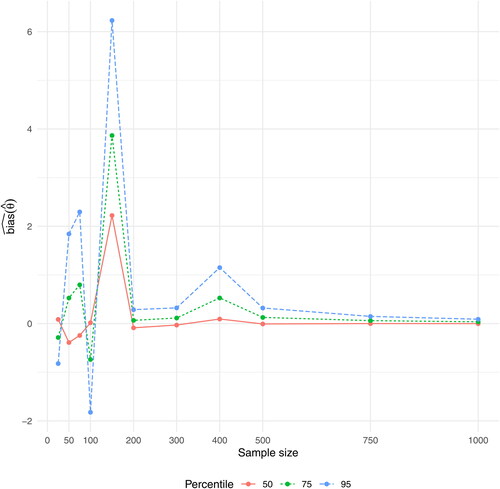
Figure 2. Graph of for the case
and
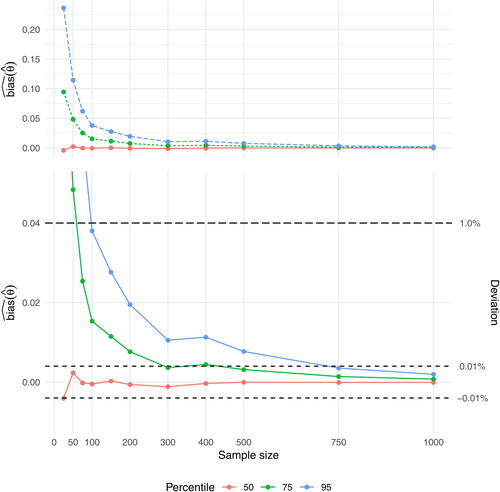
Figure 3. Graph of for the case
and
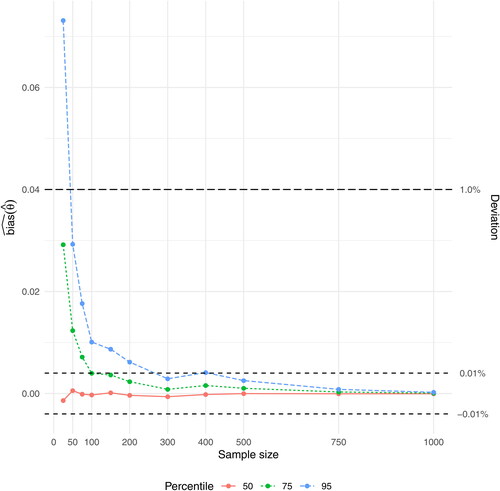
Table 2. Results of for the 50th (θ = 0), 75th (
), and 95th (
) percentile with
and
Figure 4. Graph of for the case
and
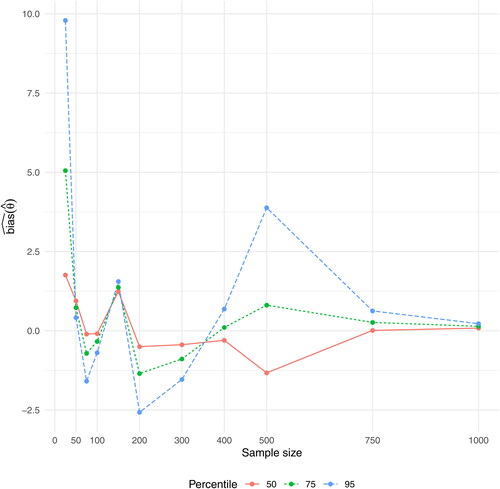
Figure 5. Graph of for the case
and
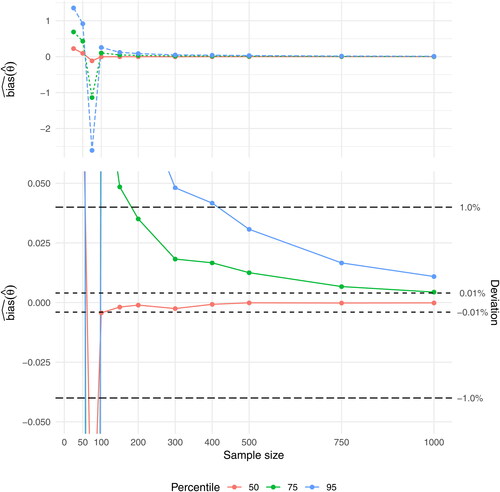
Figure 6. Graph of for the case
and