Figures & data
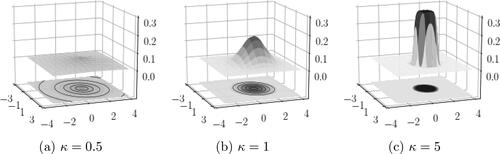
Figure 1. The density function of displayed for
Special cases of multivariate Laplace in (a) and multivariate normal in (b).
Sampler 1: LMM.
Sampler 2: one-way-ANOVA.
Figure 2. Posterior median of the mixture weight for each κ with and f = 6.
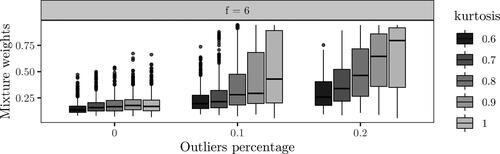
Figure 3. Posterior median of the mixture weight for each combination of κ, pe and f with pb = 0.
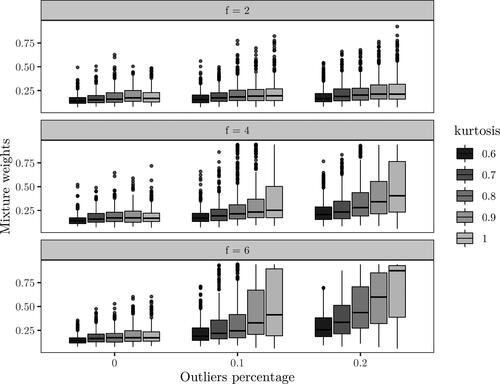
Figure 4. Cancer data.
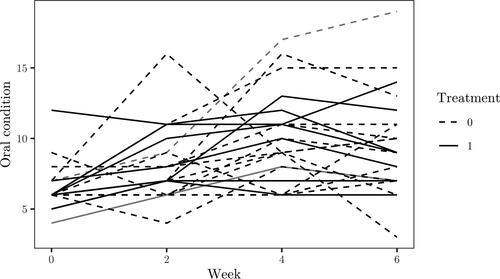
Figure 5. Posterior sample of the mixture weight for the hypotheses of no treatment effect.
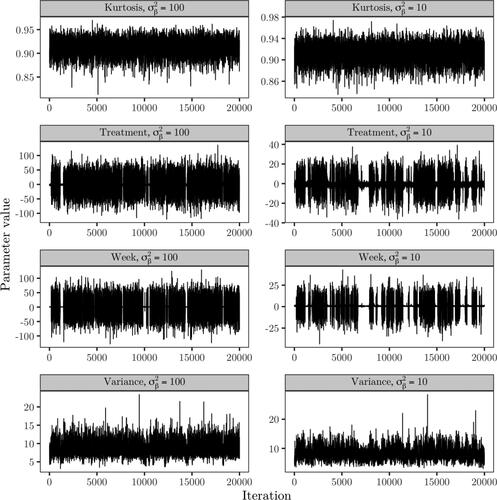
Figure 6. Trace plots of the kurtosis parameter, treatment and week fixed effect coefficients, error variance and elements of the random effects covariance based on Sampler 1.
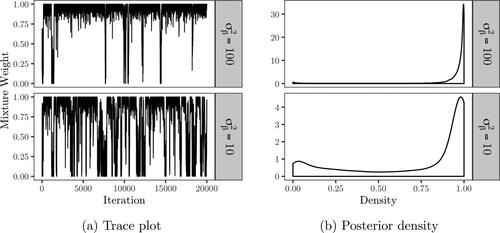
Figure 7. Posterior samples of the random effects of individuals with id 6 and 14.
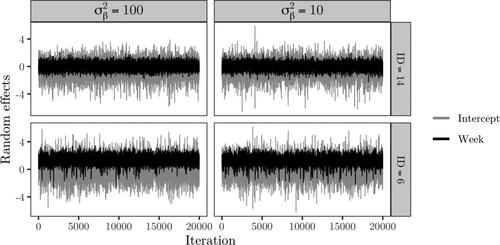
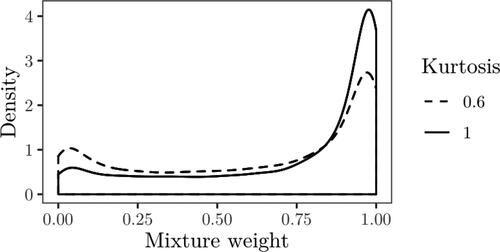
Figure 8. Posterior density of the mixture weights with the kurtosis parameter treated as a hyper-parameter.
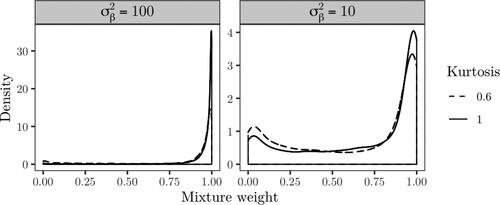
Figure 9. PAA data.
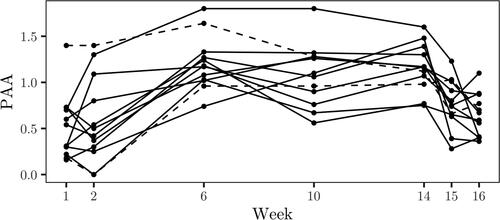
Figure 10. Posterior sample of the mixture weight for the hypotheses of the fixed effect equal to 0.5.
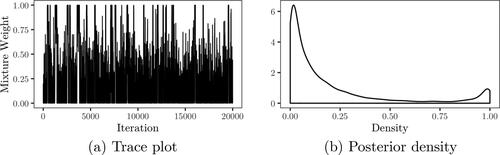
Figure 11. Trace plots of the kurtosis parameter, treatment coefficient and error and random effects variance based on Sampler 2.
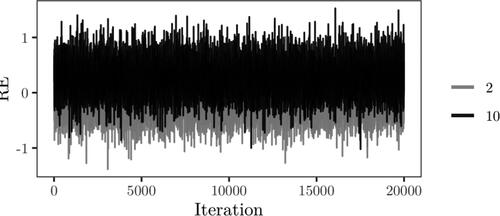
Figure 12. Posterior samples of random coefficients for individuals with id 1 and 20.
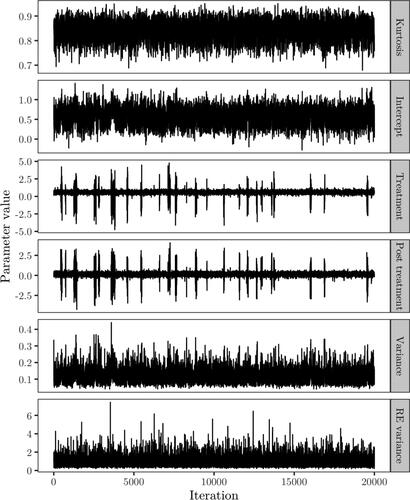
Figure 13. Posterior density of the mixture weights with the kurtosis parameter treated as a hyper-parameter.
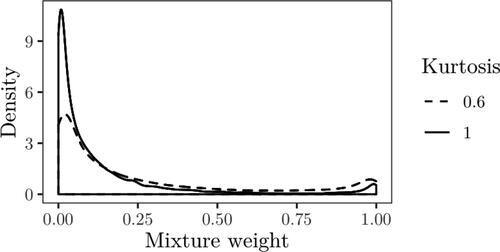
Figure 14. Posterior density of the mixture weights with the kurtosis parameter treated as a hyper-parameter.