2,990
Views
8
CrossRef citations to date
0
Altmetric
Articles

A mixture autoregressive model based on Student’s t–distribution

ORCID Icon, ORCID Icon &
Pages 499-515 | Received 27 Aug 2020, Accepted 07 Apr 2021, Published online: 26 Apr 2021

Figures & data

Figure 1. Left panel: Daily RKt (lower solid) and log(RKt) (upper solid), and mixing weights based on the estimates of the StMAR(4,2) model in (dot-dash) for the log(RKt) series. The mixing weights α̂1,t are scaled from (0, 1) to (minlog(RKt), maxlog(RKt)). Right panel: A kernel density estimate of the log(RKt) observations (solid), and the mixture density (dashes) implied by the same StMAR model as in the left panel.

Figure 1. Left panel: Daily RKt (lower solid) and log (RKt) (upper solid), and mixing weights based on the estimates of the StMAR(4,2) model in Table 1 (dot-dash) for the log (RKt) series. The mixing weights α̂1,t are scaled from (0, 1) to (min log (RKt), max log (RKt)). Right panel: A kernel density estimate of the log (RKt) observations (solid), and the mixture density (dashes) implied by the same StMAR model as in the left panel.

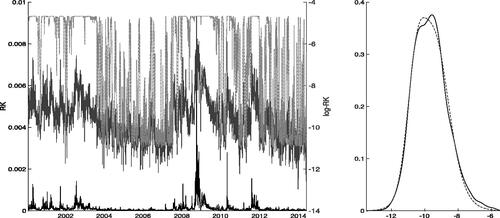
Table 1. Parameter estimates for three selected StMAR models and the log(RKt) data over the period 3 January 2000–3 June 2014.

Table 2. The percentage shares of cumulative realized kernel observations that belong to the 99%, 95% and 90% one-sided upper prediction intervals based on the distribution of 1,000,000 simulated conditional sample paths.

Supplemental material

Supplemental Material

Download PDF (395.7 KB)