
Figures & data
Table 1. Comparing estimators of the shape parameter. First four columns show the relative MSE to the MLE and the rest the bias of the ML, PWM, BRI, Jeffreys, and Hill estimators of the shape parameter, κ, from 5,000 samples of sizes n = 15, 50, 150 and with scale σ = 4 in all cases.
Figure 1. Sampling distributions of the BRI, ML, PWM, and Jeffreys posterior median estimators of the shape parameter, from 5,000 simulations of sample sizes n = 15 (top), and n = 150 (bottom). Right panels display the case κ = 3 and left when (marked by the vertical line). The right panels do not display PWM due to its poor performance. Note the MLE, BRI, and Hill estimators have relatively similar sampling distributions and are almost indistinguishable for large n.
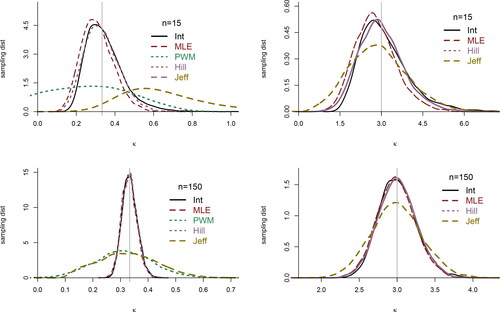
Figure 2. On the left panel, smoothed histograms of simple and log 10-day returns of the FTSE100 index from 2/4/84–26/7/13. Both distributions are almost identical, left skew with heavy tails, and present a small secondary mode on the left hand tail. On the right panel, mean excess function of the negative 10-day returns of the FTS100 (solid) with 95% confidence intervals (segmented). The positive slope suggests a heavy tail, amenable to a power distribution.
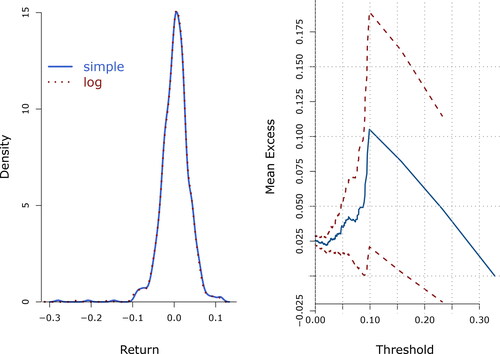
Figure 3. Histogram of the left tail of the 10-day log-returns from the FTSE100 data (in absolute value). The shape shows a power decay and heavy tails, with some extreme events, suggesting a GPD may be a suitable model.
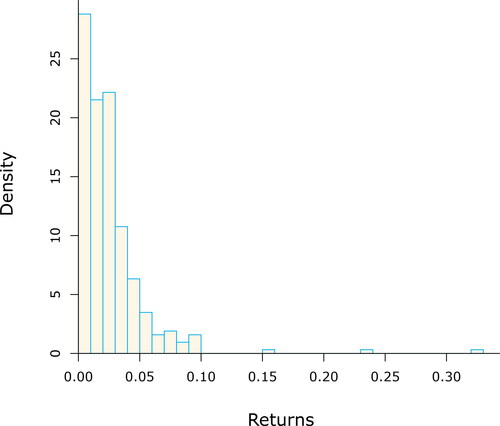
Figure 4. Marginal posterior distribution of the shape parameter from the FTSE100 data, thresholded at –5%. Marked are the BRI estimate, and interval,
The (proper) marginal Jeffreys prior is represented by the dotted line, and the corresponding equally tailed interval of probability 0.95 is
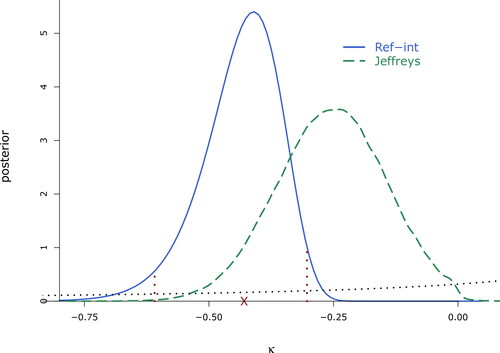
Table 2. Point and interval estimates for the FTSE100 returns data, from the four approaches. The middle point in the intervals is the corresponding point estimate. Confidence intervals are of approximate 95%, and Bayesian credible intervals of probability 0.95. The point estimate from Jeffreys prior is the posterior median.
Table A1. Some literature on GPD calibration approaches to datasets. Abbreviations are Maximum Literature (MLE), Method of Moments (MoM), Method of Medians (MM), Probability Weighted Moments (PWM), Elemental Percentile Method (EPM), Optimal Bias Robust Estimator (OBRE), Least Squares (LS), Maximum Entropy (ME), Minimum density power divergence estimator (MDPD).