
Figures & data
Table 1 Frequency of spending evenings with friends and neighbors for low-income respondents in 2012 and 2016 from Davern et al. (Citation2021).
Table 2 Frequency of everyday discrimination of low-income respondents in 2021 from Davern et al. (Citation2021).
Table 3 Estimates of measures , and
, approximate standard errors, and 95% confidence intervals applied to the data in .
Fig. F1 The sampling distribution obtained from the structure of probabilities in .
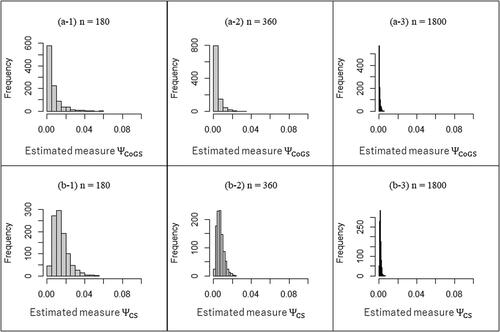
Fig. F2 The sampling distribution obtained from the structure of probabilities in .
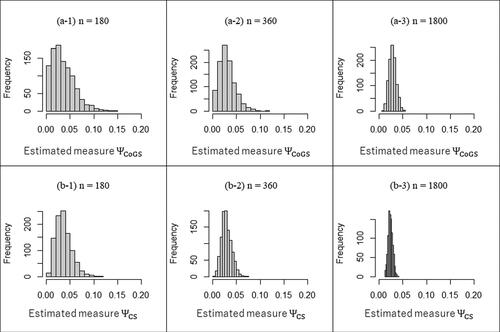
Fig. F3 The sampling distribution obtained from the structure of probabilities in .
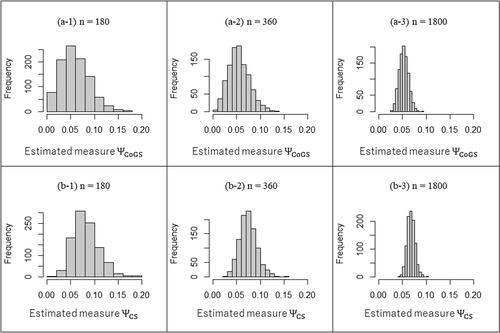
Fig. F4 The sampling distribution obtained from the structure of probabilities in .
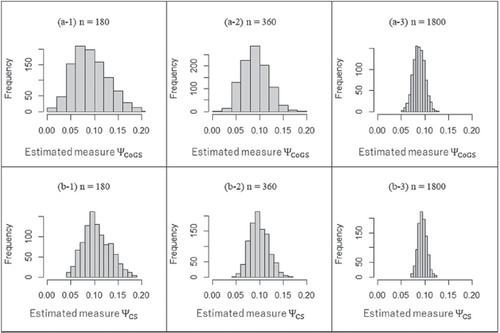
Table F1 Patterns of probability structure in a square contingency table.