
Figures & data
Table 1. The polynomial convergence rates of the MSE of the estimators and the lengths.
Table 2. Scaled MISE values (×100) and sd values (×100) for the estimators.
Table 3. Scaled MISE values (×100) and sd values (×100) for the estimators.
Table 4. Scaled MISE values (×100) and sd values (×100) for the estimators.
Table 5. Scaled MISE values (×100) and sd values (×100) for the estimators.
Figure 1. Abisko rainfall amount (in mm) from 1/1/1913 to 1/1/2015.
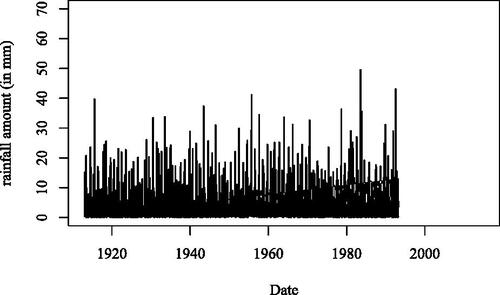
Figure 2. The estimated ED functions of Abisko rainfall amount (in mm) from 1/1/1913 to 1/1/2015 data by the non parametric approach (solid line) and by the fitting to the GPD (dashed line).
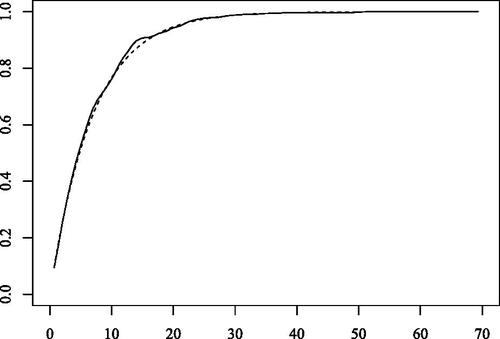
Figure 3. The estimated ED functions in [7, 14] of the Abisko rainfall amount (in mm) by the nonparametric approach (solid line) and by the fitting to the GPD (dashed line).
![Figure 3. The estimated ED functions in [7, 14] of the Abisko rainfall amount (in mm) by the nonparametric approach (solid line) and by the fitting to the GPD (dashed line).](/cms/asset/7da05ca6-332f-4f71-a9e4-5264e97a28c9/lsta_a_2358864_f0003_b.jpg)