Figures & data
TABLE 1 General Characteristics of Women by Race/Ethnicity
TABLE 2 Characteristics and Patterns of Menstrual Cycles by Race/Ethnicity
TABLE 3 Total and Individual Menstrual Concerns and Dysmenorrhea Scores (Mean ± SEM) by Race/Ethnicity After Adjusting for Age, Rank, Use of OC, Time Deployed, and Strenuous Activity
FIGURE 1 The percent of CA, AS, HIS, and AA women who reported being bothered minimally and severely by various menstrual issues (*p < 0.05).
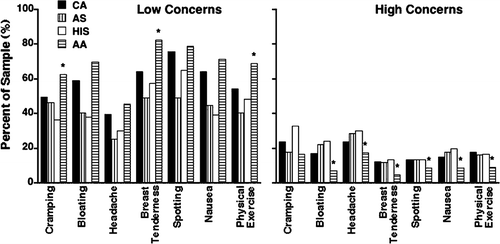
FIGURE 2 The percent of CA, AS, HIS, and AA women reporting mild, moderate, and severe dysmenorrhea (*p < 0.05).
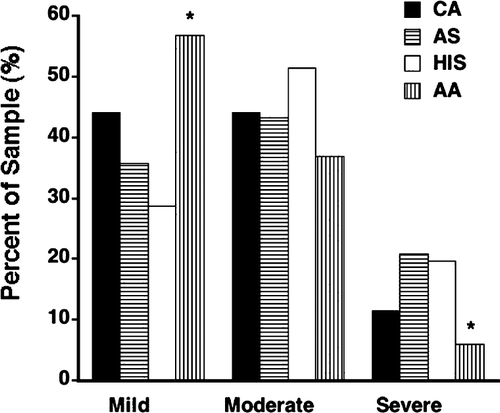
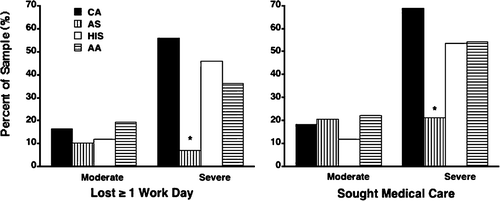
FIGURE 3 The percent of CA, AS, HIS, and AA women with moderate and severe dysmenorrhea who reported missing ≥ 1 day of work and seeking medical treatment for dysmenorrhea (*p < 0.05).