
Figures & data
Figure 1. The structures of MS-275 and its chemical analogues that produced the highest Hb-inducing activity in K562 cells.
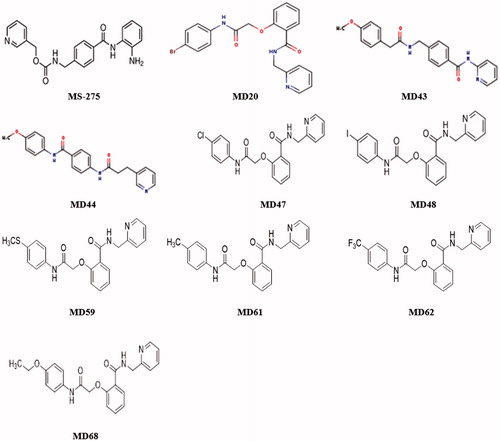
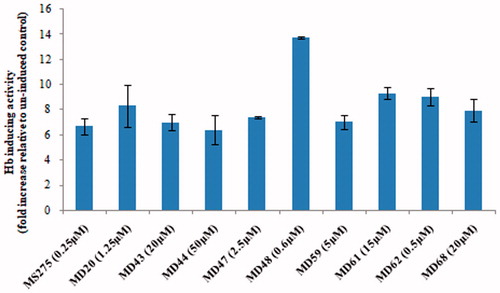
Figure 2. The Hb-inducing activity of MS-275 and its chemical analogues that exhibited the highest activity in K562 cells. The Hb-inducing activity was measured using a benzidine stain. All agents displayed an ∼50.0% cell survival at the concentrations used. The results are the average of three or more experiments with error bars corresponding to the standard deviation. Addition of these chemical compounds to K562 cells resulted in a statistically significant increase in Hb induction relative to the uninduced control, according to the paired t-test (p value of <0.05).
Supplemental material