Figures & data
Figure 1. Multiple ligation-dependent probe amplification analysis showed a heterozygous deletion in the β-globin cluster. Deletions were determined with a ratio <0.7. The deletion region extended from probe HBB up 337 bp to HBB EXON 2 196 bp.
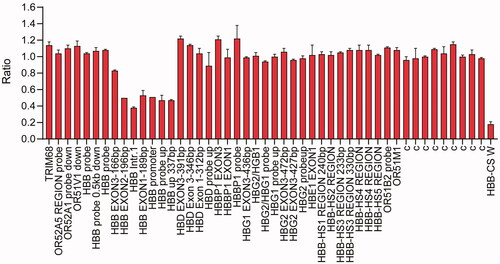
Figure 2. Molecular characterization of the 5 kb deletion. (A) Single molecule real-time sequencing analysis of the patient. The light yellow and blue regions indicate the two alleles of the β-globin gene cluster. The arrows indicate the region of the deletion. The blue dots indicate sequencing errors. The relative positions of the HBD, HBB and AC104389.7 genes on chromosome 16 are indicated by blue boxes. The vertical colored lines indicate nucleotides A (green), T (red), C (blue) and G (orange) discordant with alignment to the Hg38 reference sequence. (B) Gap-PCR analysis showing a unique 600 bp product in the proband. M: marker; N: normal control. (C) Sanger sequencing results of the deletion. The arrows indicate the breakpoints of the deletion.
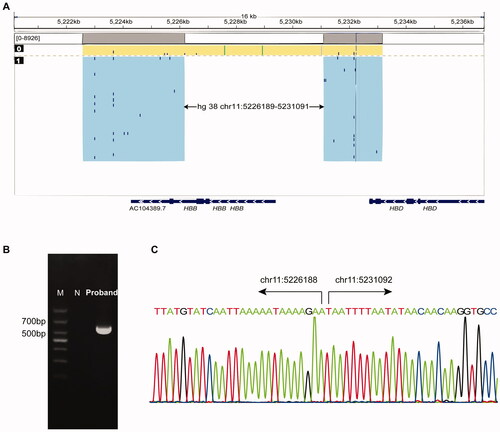
Table 1. The hematological data of the patient.
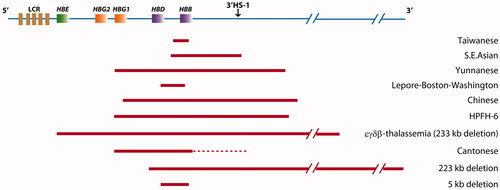
Figure 3. The known deletions found in the Chinese population. Large deletions are shown as horizontal red boxes. The red dotted lines indicate that the endpoint has not been determined.