
Figures & data
Table 1. Conceptualizations and operationalizations of core concepts.
Table 2. Percentage of misbelief by statement.
Figure 1. Conversion of two-mode belief network to (mis)information network.
Note: S = Statement. Edges in the two-mode belief network occur when respondents believe statements regardless of their veracity to be true. The two-mode belief network is transformed into (mis)information network through a process known as projection. The strength of the edges in the (mis)information network is assigned based on the proportion of respondents who simultaneously believe in two distinct statements.
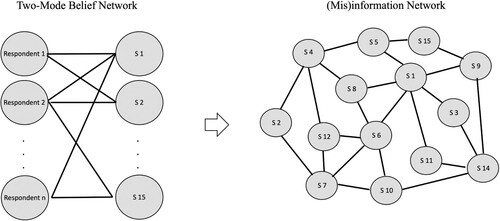
Figure 2. Overall (mis)information network.
Note: The shape of a node indicates the veracity of statements. Square-shaped nodes represent true statements, while round-shaped nodes represent false statements. The thickness of the line indicates the degree of connection between statements. The thicker the line between a pair of statements, the more participants co-believe them.
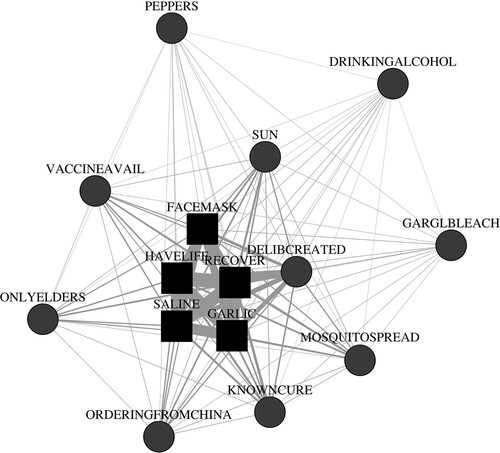
Figure 3. (A) Liberal and (B) Conservative (mis)information network.
Note: The shape of a node indicates the veracity of statements. Square-shaped nodes represent true statements, while round-shaped nodes represent false statements. The thickness of the line indicates the degree of connection between statements. The thicker the line between a pair of statements, the more participants co-believe them.
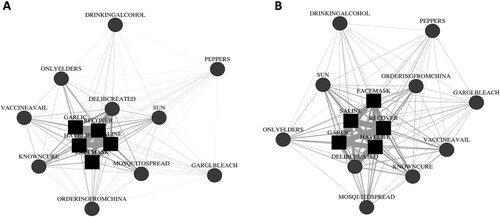
Figure 4. Cluster analysis results of (A) Liberal and (B) Conservative (mis)information network.
Note: The shape of a node indicates the veracity of statements. Square-shaped nodes represent true statements, while round-shaped nodes represent false statements. The color and shade of nodes indicate cluster membership. Nodes in blue color are clustered in one group, while nodes in orange color are clustered in another group. Edges between nodes are omitted for visual simplicity.
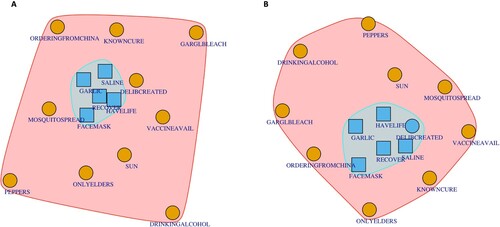
Figure 5. Disassortative and assortative patterns between liberal and conservative groups.
Note: Pairs of statements are categorized into three conditions based on veracity. If both statements are true, the pair is assigned to the true-true condition. If both statements are false, the pair is assigned to the false-false condition. If the veracity of statements is mixed, the pair is assigned to the false-true condition.
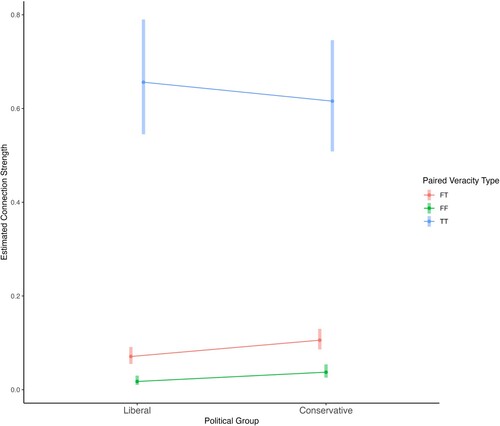
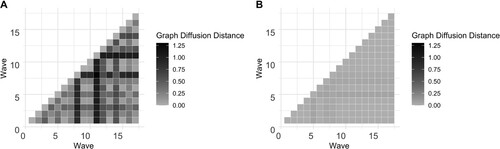
Figure 6. Bivariate graph diffusion distances of (A) the liberal group and (B) the conservative group.
Supplemental Material
Download MS Word (1.2 MB)Data availability statement
The data and code will be shared upon request.