
Figures & data
Table 1. Composition (w/w %) of nonionic formulations.
Table 2. Composition (w/w %) of cationic SEDDS.
Table 3. Chemical structure of cationic surfactants incorporated in SEDDS.
Figure 1. (A–D) Zeta potential (mV) of nonionic (A) and cationic (B) SEDDS (0.5% m/v) emulsified in water containing indicated concentrations of bile salts; Zeta potential of nonionic (C) and cationic (D) SEDDS (0.5% m/v) emulsified in water containing indicated concentrations of sodium decanoate. Indicated values are means ± SD (n = 3). (Two way ANOVA vs water, * p < 0.05, ** p < 0.01, *** p < 0.001).
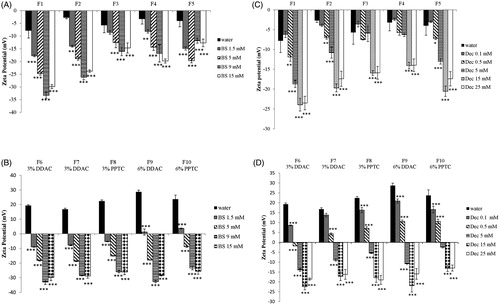
Figure 2. (A–D) Size (nm) of nonionic (A) and cationic (B) SEDDS (0.5% m/v) emulsified in water containing indicated concentrations of bile salts; Size (nm) of nonionic (C) and cationic (D) SEDDS (0.5% m/v) emulsified in water containing indicated concentrations of sodium decanoate. Indicated values are means ± SD (n = 3). (Two way ANOVA vs water, * p < 0.05, ** p < 0.01, *** p < 0.001).
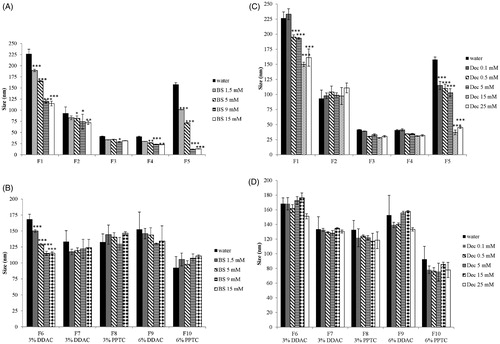
Figure 3. (A –D) PDI of nonionic (A) and cationic (B) SEDDS (0.5% m/v) emulsified in water containing indicated concentrations of bile salts; PDI of nonionic (C) and cationic (D) SEDDS (0.5% m/v) emulsified in water containing indicated concentrations of sodium decanoate. Indicated values are means ± SD (n = 3). (Two way ANOVA vs water, * p < 0.05, ** p < 0.01, *** p < 0.001).
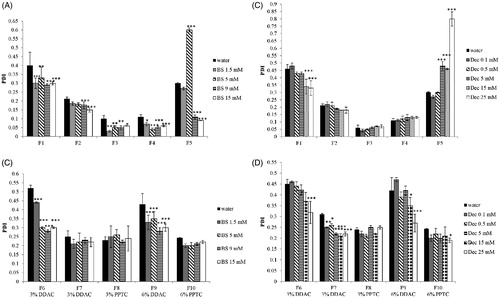
Figure 4. (A ,B) Size distribution of formulation F5 emulsified in water and water containing 5 mM (BS 5 mM) and 15 mM (BS 15 mM) bile salts (A); Size distribution of formulation F5 emulsified in water and water containing 5 mM (Dec 5 mM) and 15 mM (Dec 15 mM) sodium decanoate (B).
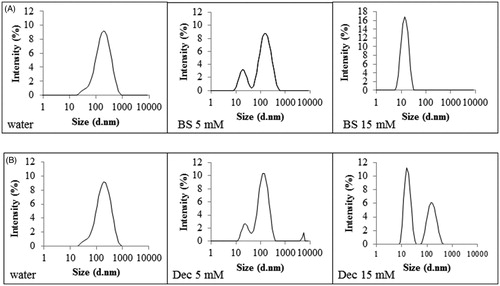
Figure 5. (A–D): Transmittance % of nonionic (A) and cationic (B) SEDDS (0.5% m/v) emulsified in water containing indicated concentrations of bile salts; Transmittance % of nonionic (C) and cationic (D) SEDDS (0.5% m/v) emulsified in water containing indicated concentrations of sodium decanoate. Indicated values are means ± SD (n = 3). (Two way ANOVA vs water, * p < 0.05, ** p < 0.01, *** p < 0.001).
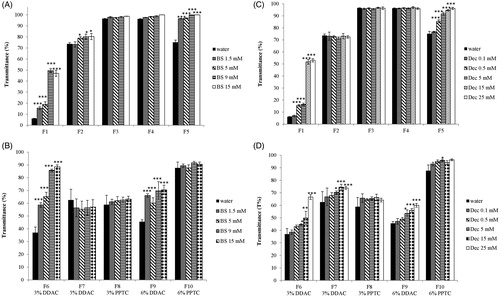
Figure 6. (A–D) Cloud point temperature (CPT) of nonionic (A) and cationic (B) SEDDS (0.5% m/v) emulsified in water containing indicated concentrations of bile salts; (CPT) of nonionic (C) and cationic (D) SEDDS (0.5% m/v) emulsified in water containing indicated concentrations of sodium decanoate. Indicated values are means ± SD (n = 3). (Two way ANOVA vs water, * p < 0.05, ** p < 0.01, *** p < 0.001. In case of formulations having a cloud point temperature above 100 °C, (CPT) was not experimentally determined, therefore statistical analysis was performed assuming a (CPT) equal to 100 °C).
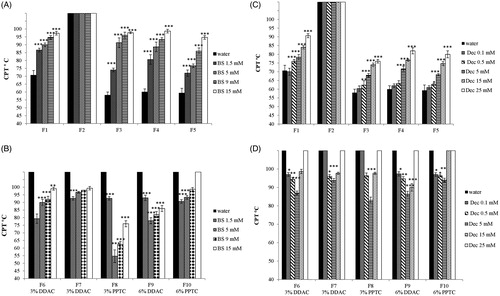
Figure 7. Release of quinine from ni-SEDDS (F1, F2, F3, F4 and F5) and c-SEDDS (F6, F7, F8, F9, F10) at time points 15,60,120,180,240 min in water (w) and BS (15 mM) and dec (25 mM) containing medium (b).
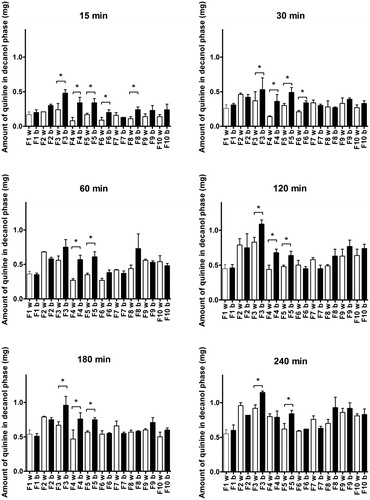
Table A1. Zeta potential (mV) of nonionic (ni-SEDDS) and cationic (c-SEDDS) SEDDS (0.5% m/v) emulsified in water containing indicated concentrations of bile salts or decanoate; Indicated values are means ± SD (n = 3).
Table A2. Size (nm) of nonionic (ni-SEDDS) and cationic (c-SEDDS) SEDDS (0.5% m/v) emulsified in water containing indicated concentrations of bile salts or decanoate; Indicated values are means ± SD (n = 3). Formulations not significantly affected by bile salts or decanoate are not reported in the table.
Table A3. PDI of nonionic (ni-SEDDS) and cationic (c-SEDDS) SEDDS (0.5% m/v) emulsified in water containing indicated concentrations of bile salts or decanoate; Indicated values are means ± SD (n = 3). Formulations not significantly affected by bile salts or decanoate are not reported in the table.
Table A4. Transmittance (%) of nonionic (ni-SEDDS) and cationic (c-SEDDS) SEDDS (0.5% m/v) emulsified in water containing indicated concentrations of bile salts or decanoate; Indicated values are means ± SD (n = 3). Formulations not significantly affected by bile salts or decanoate are not reported in the table.
Table A5. Cloud point temperature (°C) of nonionic (ni-SEDDS) and cationic (c-SEDDS) SEDDS (0.5% m/v) emulsified in water containing indicated concentrations of bile salts or decanoate; Indicated values are means ± SD (n = 3). Formulations not significantly affected by bile salts or decanoate are not reported in the table.