Figures & data
Table 1. Qualitative description, grade, and quantitative range of bitterness value (I).
Table 2. Drug bitterness sort and score table.
Table 3. Sensor taste information.
Figure 1. Chemical structures of Acesulfame K (A) and berberine hydrochloride (B).
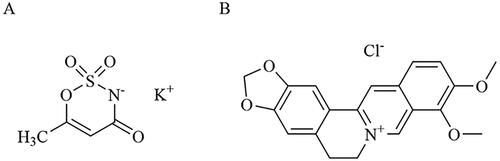
Figure 2. (A) The taste-masking effect of 0.005% g·mL−1 BH by different concentrations of AK. (B) The taste-masking effect of 0.5% g·mL−1 BH by different concentrations of AK. (C) The taste-masking effect of 0.1% g·mL−1 AK on different concentrations of BH. Note. nsp > 0.05; *p < 0.05; **p < 0.01.
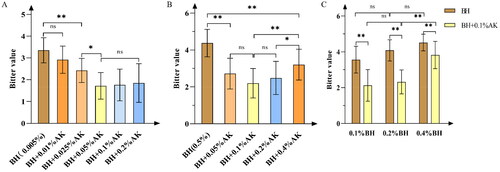
Figure 3. (A) The taste radar plot of 0.005% g·mL−1 BH by different concentrations of AK. (B) The taste radar plot of 0.1% g·mL−1 AK on different concentrations of BH. And a, b, and c are BH solution without AK, their concentrations are 0.4, 0.2, and 0.1% g·mL−1, respectively. Aa, Ab, and Ac are BH solutions with 0.1% g·mL−1 AK, respectively.
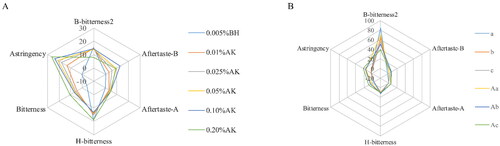
Figure 4. DSC curves of AK (A), BH (B), the physical mixtures of BH and AK (C), and the complex (D) formed by BH and AK 1:1 (molar ratio).
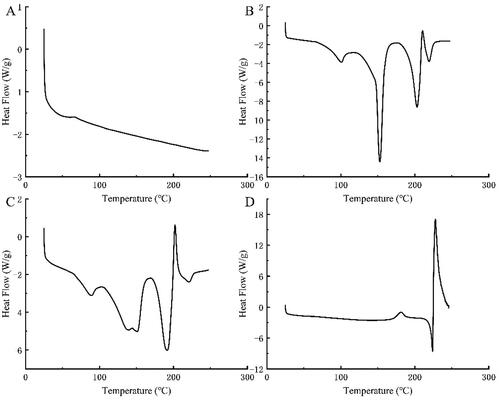
Figure 5. X-ray diffraction patterns of AK, BH, the physical mixtures of BH and AK, and the complex formed by BH and AK 1:1 (molar ratio).
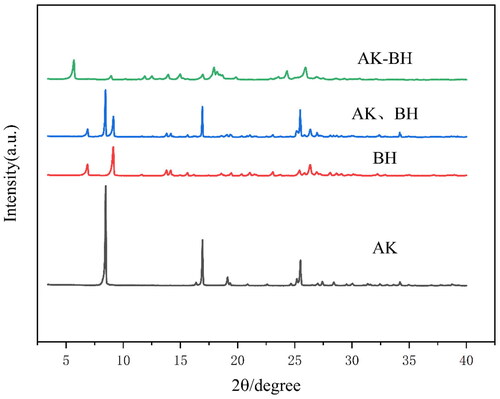
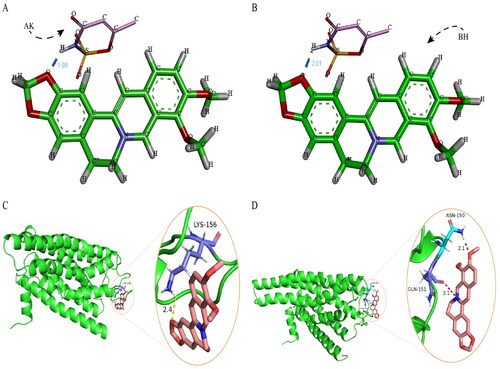
Figure 6. (A,B) Two dominant conformations of AK docking with BH. (C,D) The docking results of BH docking with TAS2R46 protein.