
Figures & data
Figure 1. Papp of [14C]-mannitol measured under different NPs exposures over time: (A) PG-2, (B) PG + 2, (C) PL-2, (D) PL + 2, (E) PG-5, (F) PG + 5, (G) PG-8, and (H) PG + 8 (Mean ± SD, n = 3).
![Figure 1. Papp of [14C]-mannitol measured under different NPs exposures over time: (A) PG-2, (B) PG + 2, (C) PL-2, (D) PL + 2, (E) PG-5, (F) PG + 5, (G) PG-8, and (H) PG + 8 (Mean ± SD, n = 3).](/cms/asset/47f279eb-8413-47dd-84c8-2d2f0f45d90b/iddi_a_2332889_f0001_c.jpg)
Table 1. Characterization of polymeric of NPs; size, PDI, and zeta potential/charge of 8 different NPs (mean ± SD, n = 3).
Figure 2. NPs internalization and the effects of different inhibitors (inhibitor mechanisms detailed in Materials section) on the internalization of (A) PG-2, (B) PG + 2, (C) PL-2, (D) PL + 2, (E) PG-5, (F) PG + 5, (G) PG-8, (H) PG + 8; where Inh1: Dynasore, Inh2: Genistein, Inh3: Cytochalasin D, Inh4: Nocodazole, Inh5: EIPA, Inh6: Methyl-β-cyclodextrin, Inh7: Chlorpromazine (• Dunnett test comparison to NC, •• p < 0.01, • • • p < 0.001, • • • • p < 0.0001) (Mean ± SD, n = 3).
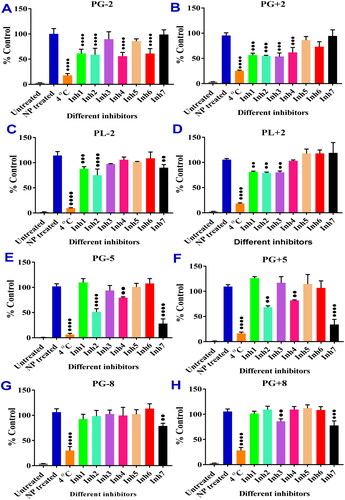
Figure 3. Confocal microscopy images of Calu-3 cells where nuclei labeled by DAPI/Blue and cell membranes labeled by AF488/Green after incubation for 1 h with (0.5 mg/mL) NP-NRs/Red (A: all negatively-charged NPs and B: their positively-charged counterparts).
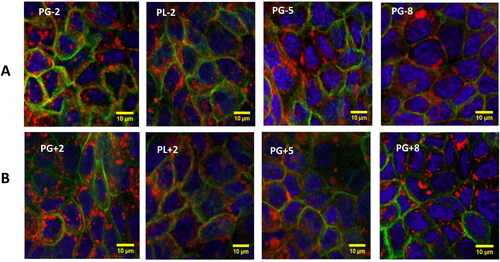
Figure 4. Confocal microscopy images of Calu-3 cells where nuclei labeled by DAPI/Blue and lysosomes labeled by LT-26/Green after incubation for 1 h with (0.5 mg/mL) NP-NRs/Red (A: all negatively-charged NPs and B: their positively-charged counterparts).
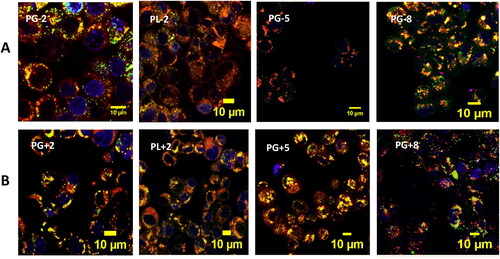
Table 2. Summary of the endocytosis transport inhibitors results (overview of all NPs and the different inhibitors used, inhibitor mechanisms detailed in materials section) (-non-significant, ++p < 0.01, +++p < 0.001, ++++p < 0.0001).