Figures & data
Figure 1. The scheme of Allium cepa growth at different concentrations of sodium salts.
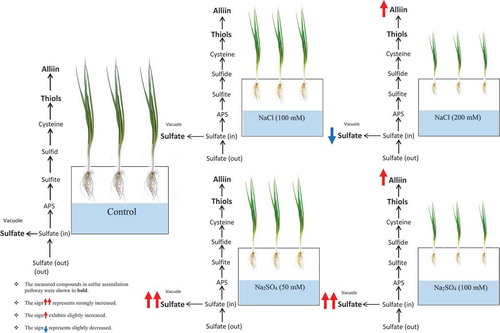
Figure 2. Impact of NaCl and Na2SO4 salinity on plant biomass, shoot/root ratio and dry matter content of root and shoot of Allium cepa. Different letters indicate significant difference (p < 0.01; One-way ANOVA, Tukey’s HSD all-pairwise comparisons as a post-hoc test).
Figure 3. Impact of NaCl and Na2SO4 salinity on chloride, sulfate and nitrate content of root and shoot of Allium cepa. Different letters indicate significant difference (p < 0.01; One-way ANOVA, Tukey’s HSD all-pairwise comparisons as a post-hoc test).
Figure 4. Impact of NaCl and Na2SO4 salinity on mineral nutrient composition of root and shoot of Allium cepa. Different letters indicate significant difference (p < 0.01; One-way ANOVA, Tukey’s HSD all-pairwise comparisons as a post-hoc test).
Figure 5. Impact of NaCl and Na2SO4 salinity on water-soluble non-protein thiols content of root and shoot of Allium cepa. Different letters indicate significant difference (p < 0.01; One-way ANOVA, Tukey’s HSD all-pairwise comparisons as a post-hoc test).
Figure 6. Impact of NaCl and Na2SO4 salinity on alliin content of root and shoot of Allium cepa. Different letters indicate significant difference (p < 0.01; One-way ANOVA, Tukey’s HSD all-pairwise comparisons as a post-hoc test).