Figures & data
Table 1. Effects of exogenous IAA on biomass of sweetpotato under different K+ levels.
Table 2. Effects of exogenous IAA on K+ content and accumulation of sweetpotato under different K+ levels.
Table 3. Sequence of primers for ARF and related genes used for qRT-PCR.
Figure 1. Effects of exogenous IAA on endogenous IAA content in leaves (a and b) and roots (c and d) of sweetpotato under different K+ levels. Data are means ± standard deviation (n = 3), different letters (a, b and c, etc.) on columns indicate significant differences between treatments on the same day (P < 0.05, Duncan’s test).
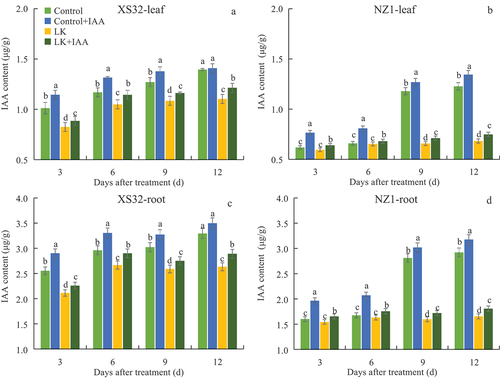
Figure 2. Effects of exogenous IAA on total root morphology of sweetpotato under different K+ levels. (a and b) total root length; (c and d) root forks number; (e and f) root crossings number. Data are means ± standard deviation (n = 3), different letters (a, b and c, etc.) on columns indicate significant differences between treatments on the same day (P < 0.05, Duncan’s test).
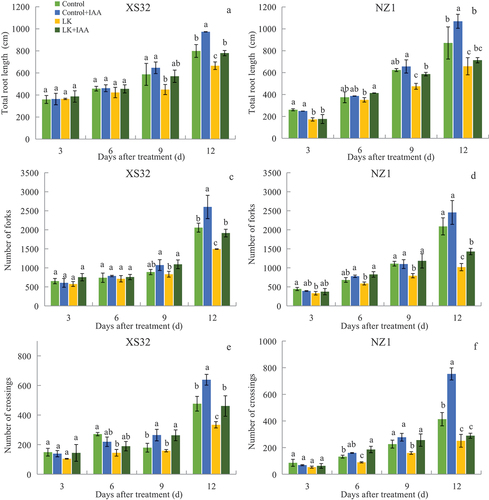
Figure 3. Effects of exogenous IAA on lateral root characteristics of sweetpotato under different K+ levels. (a and b) lateral root length; (c and d) lateral root ratio; (e and f) lateral root density. Data are means ± standard deviation (n = 3), different letters (a, b and c, etc.) on columns indicate significant differences between treatments on the same day (P < 0.05, Duncan’s test).
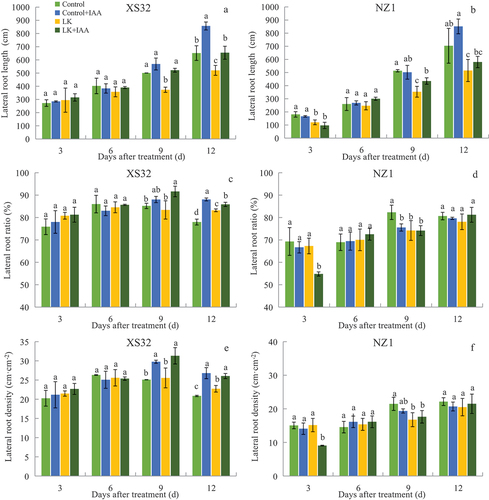
Figure 4. Effects of exogenous IAA on expression levels of auxin biosynthesis genes of sweetpotato under different K+ levels. (a, b, e and f) expression of IbYUC6; (c, d, g and h) expression of IbTAR2. Data are means ± standard deviation (n = 3),different letters (a, b and c, etc.) on columns indicate significant differences between treatments on the same day (P < 0.05, Duncan’s test).
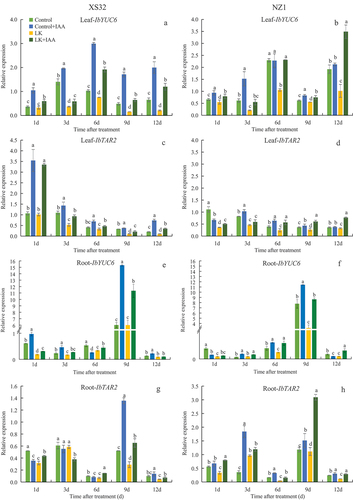
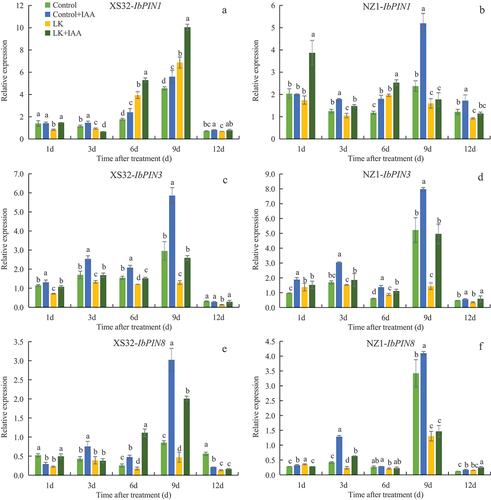
Figure 5. Effects of exogenous IAA on expression levels of auxin transport genes in leaves of sweetpotato under different K+ levels. (a and b) expression of IbPIN1; (c and d) expression of IbPIN3;(e and f) expression of IbPIN8. Data are means ± standard deviation (n = 3), different letters (a, b and c, etc.) on columns indicate significant differences between treatments on the same day (P < 0.05, Duncan’s test).
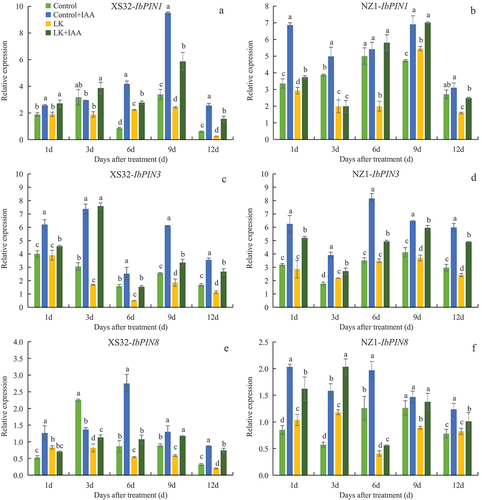
Figure 6. Effects of exogenous IAA on expression levels of auxin transport genes in roots of sweetpotato under different K+ levels. (a and b) expression of IbPIN1; (c and d) expression of IbPIN3;(e and f) expression of IbPIN8. Data are means ± standard deviation (n = 3), different letters (a, b and c, etc.) on columns indicate significant differences between treatments on the same day (P < 0.05, Duncan’s test).