
Figures & data
Figure 1. Artificial neural network (ANN) architecture.
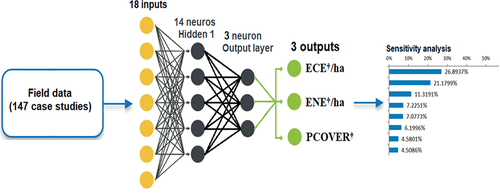
Table 1. Variables of the model.
Table 2. Number of data used for training, validation, and testing.
Table 3. Best training, validation, and test results.
Figure 2. ANN model performance.
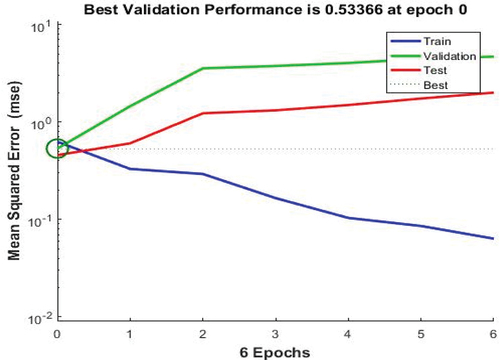
Figure 3. Linear regression models from the developed ANN.
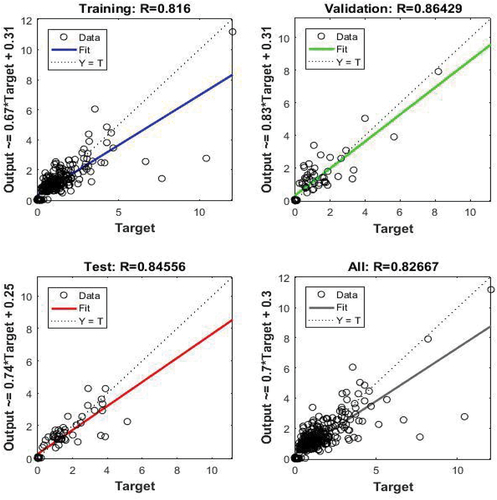
Figure 4. Sensitivity analysis for the output variable ECE/ha.
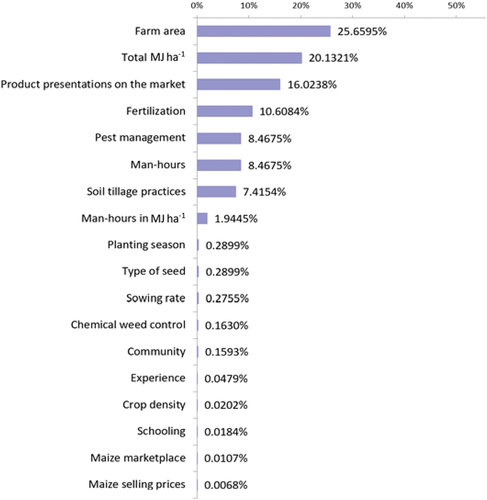
Figure 5. Sensitivity analysis for the output variable ENE/ha.
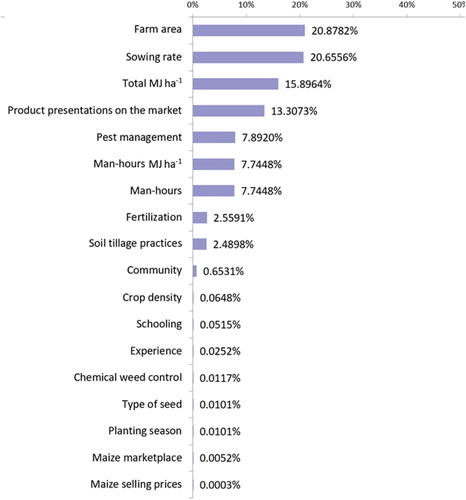
Figure 6. Sensitivity analysis for the output variable PCOVER.
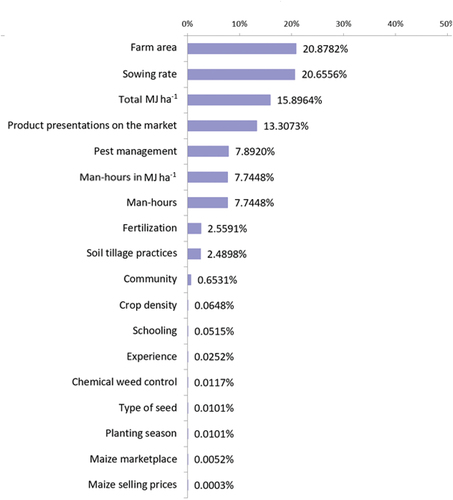
Figure 7. Displays a comparison between observed values () -vs- Modified values () in ECE/ha.
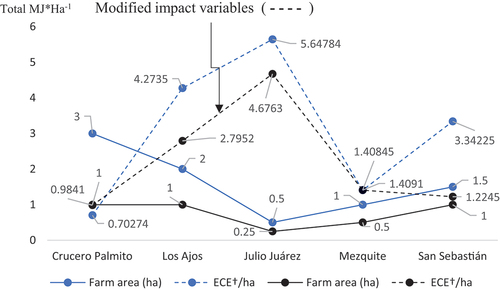
Table 4. Major impact variables that maximizes the efficiencies on the use of the human resources.
Table 5. Modified impact variables to maximize the economic efficiencies on the use of resources.
Table 6. Modified impact variables to minimize the economic efficiencies on the use of resources.
Figure 8. Displays a comparison between observed values () and modified values () for energy efficiency (Ene ha−1) at a sowing rate of 50 kg ha−1.
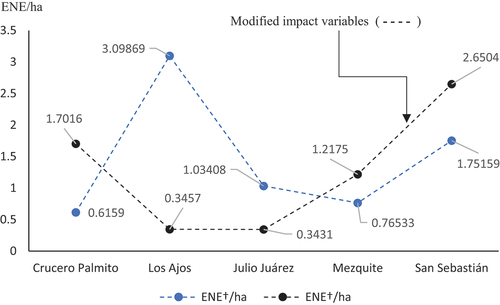
Table 7. Major impact variables to maximize the efficiencies on the use of energy.
Table 9. Modified impact variables to minimize the economic efficiencies on the use of energetic resources.
Table 8. Modified impact variables to maximize the economic efficiencies on the use of energetic resources.
Table 10. Major impact variables to maximize the percentage of poverty line coverage.
Table 11. Modified impact variables to maximize the percentage of poverty line coverage.
Table 12. Modified impact variables to minimize the percentage of poverty line coverage.
Table A1. Classification and description of these input/output variables.