
Figures & data
Table 1. Test statistics for genotype (G), environment (E), and GEI using ANOVA of pooled data for twenty-four cotton genotypes across five years (2016–2020) under normal irrigation regime and drought stress conditions.
Table 2. Eberhart and Russell joint regression of seed yield for twenty-four cotton genotypes across five years (2016–2020) under normal irrigation regime and drought stress conditions.
Table 3. Combined analysis of variance with AMMI analysis for seed yield of twenty-four cotton genotypes across five years (2016–2020) under normal irrigation regime and drought stress conditions.
Table 4. Seed yield (kg ha−1) of twenty-four cotton genotypes across five years (2016–2020) under normal irrigation regime and drought stress conditions.
Figure 1. Dendrogram of classified genotypes in growing seasons by cluster analysis during normal irrigation regime and drought stress conditions. The color of each block deepens with the increase of the corresponding cotton seed yield, then the color depth decreases, and the color scale ranges from mild for the moderate yield to white for the lowest yield. The genotypes key names can be found in Table S1. Seasons of 2016, 2017, 2018, 2019, and 2020 represent the five tested environments.
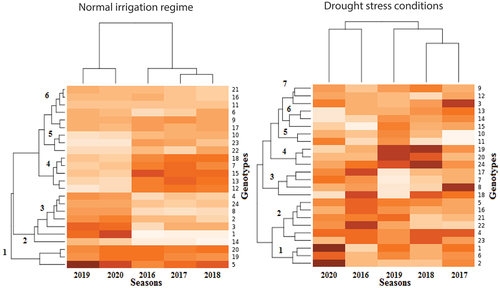
Table 5. Mean performance and stability parameters for twenty-four cotton genotypes across environments under normal irrigation regime and drought stress conditions based on joint regression and AMMI analysis.
Figure 2. AMMI biplot of PC1 vs seed yield for twenty-four cotton genotypes (green color) and five environments (blue color) under normal irrigation regime and drought stress conditions. The genotypes and environment key names can be found in Table S1 and Figure S1, respectively.
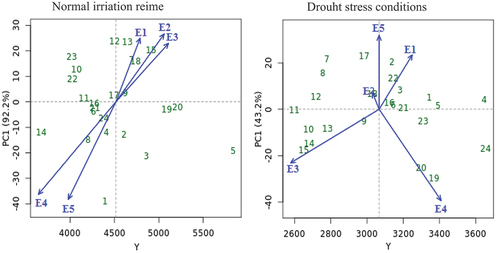
Figure 3. AMMI biplot of PC1 vs PC2 for seed yield with twenty-four cotton genotypes (green color) and five environments (blue color) under normal irrigation regime and drought stress conditions. The genotypes and environment key names can be found in Table S1 and Figure S1, respectively.
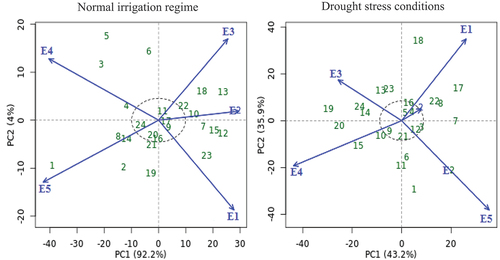
Figure 4. GGE biplot polygon of ‘which-won-where’ for seed yield with twenty-four cotton genotypes (green color) and five environments (blue color) under normal irrigation regime and drought stress conditions. The genotypes and environment key names can be found in Table S1 and Figure S1, respectively.
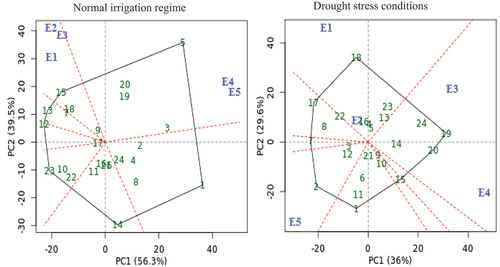
Figure 5. GGE biplot of mean vs. stability for seed yield with twenty-four cotton genotypes (green color) and five environments (blue color) under normal irrigation regime and drought stress conditions. The genotypes and environment key names can be found in Table S1 and Figure S1, respectively.
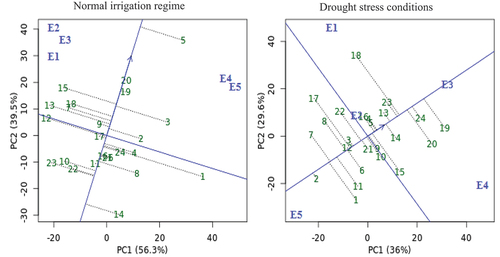
Figure 6. GGE biplot of discrimitiveness vs. representativeness for seed yield with twenty-four cotton genotypes (green color) and five environments (blue color) under normal irrigation regime and drought stress conditions. The genotypes and environment key names can be found in Table S1 and Figure S1, respectively.
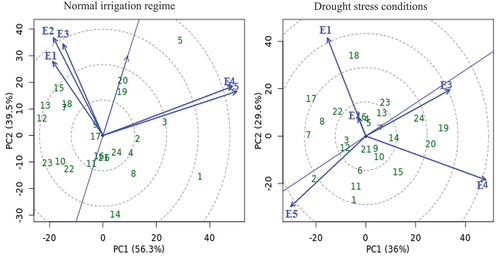
Table 6. Ranks of twenty-four genotypes in five environments using mean cotton yield stability statistics based on JRA, AMMI and GGE models.
Table 7. Spearman’s rank correlation coefficients among mean cotton yield and stability statistics of different statistical models across normal irrigation regime and drought stress conditions.