
Figures & data
Table 1. Physical and chemical properties of soil in the study area.
Figure 1. Grey scale intensity of soil columns scanned using X-ray computed tomography and blue denotes soil macropores.
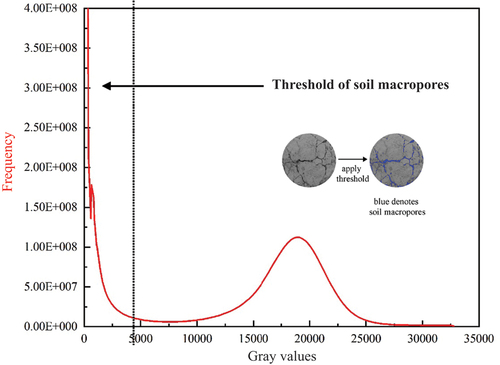
Table 2. Soil organic matter (g/kg) under different treatments after 2 years.
Figure 2. Three-dimensional visualization of soil macropores under different treatments (blue denotes soil macropores).
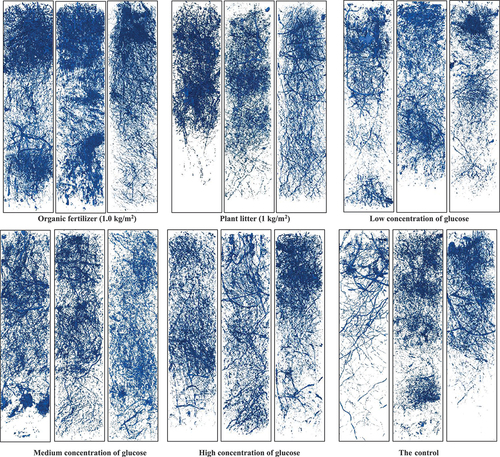
Table 3. Soil macropore characteristics of all soil columns as determined using the X-ray computed tomography under different treatments.
Figure 3. Total PLFAs, total bacteria, G+ bacteria, G− bacteria, fungi and actinomycetes under different treatments.
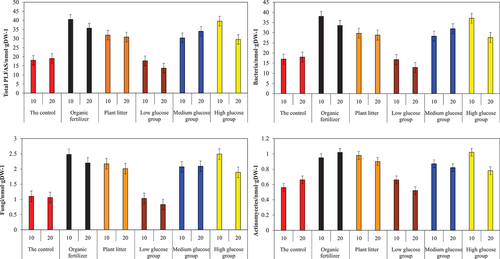
Table 4. Total phospholipid fatty acids (PLFAs), total bacterial, fungal, actinomycete, gram-positive bacterial and gram-negative bacterial contents under different treatments.
Table 5. The dyed area ratio and the maximum wetting depth under different treatments.
Table 6. Correlations between soil organic matter and soil structure (0–30 cm).
Table 7. Correlations between the soil microbial community and soil pore structure.